How nuclear weapons research revealed new climate threats
After atmospheric scientist Ivana Cvijanovic began pushing a computerized climate simulation to its limits, she noticed a disturbing result: as Arctic sea ice nearly disappeared, massive high-pressure systems built up thousands of miles away, off the west coast of the United States.
The atmospheric ridge blocked major storms bound for California, cutting off rainfall. Cvijanovic’s model shows that as the North Pole’s summer sea ice vanishes, as expected in the next few decades, it could turn down the tap for Central Valley farmers, Sierra Nevada ski resorts, and cities throughout the nation’s most populous state (see “The Year Climate Change Began to Spin Out of Control”).

The results, published in Nature Communications in December, also suggest that shrinking sea ice may have played a role in the extreme, costly drought that plagued California for most of this decade. That was driven by a “ridiculously resilient ridge” closely resembling the one that Cvijanovic’s simulation predicts.
Climate models are often derided as unreliable approximations of Earth’s complex systems, particularly among climate change deniers. But thanks to advances in computational power, the inclusion of more planetary components, and other technical strides, these simulations are becoming incredibly powerful.
They can predict with growing certainty how global warming is already altering the planet, and how it’s likely to in the future. In particular, the improvements are helping scientists to untangle the complex mechanisms driving extreme weather events.
Cvijanovic had tried to study the puzzling connections between melting ice and faraway precipitation changes for years. But standard climate models didn’t offer a way to simulate the processes in a realistic way, until a recent breakthrough arrived from an unlikely source: nuclear weapons research.
Flipping the coin again
Cvijanovic’s curiosity had taken on a new urgency by the time she landed as a postdoctoral researcher at California’s Lawrence Livermore National Laboratory in 2014. Two summers earlier, Arctic sea ice had melted away far faster than scientists expected. Nearly five million square miles of ice disappeared from the peak period in late March, by far the biggest loss ever recorded.
It was a glaring sign that something was off in climate models—and on the scarier end of the spectrum.
Climate models are software simulations that estimate how Earth reacts to various influences, like massive increases in carbon dioxide emissions, by running mathematical equations that represent our best understanding of physical laws. They calculate how shifting conditions ripple across time and space, rendering the oceans, surface, and atmosphere in a 3-D grid of boxes. Over the last few decades, the models’ resolution has greatly increased: the area each box represents has gone from 500 square kilometers down to less than 25 in some cases, even as the models incorporated aerosols, sea ice, vegetation, and other interconnected factors.
For all these vast improvements, however, there are sometimes still big gaps between what the models predict and how the real world behaves, as the dramatic loss of sea ice underscored (see “Why Climate Models Aren’t Better”).
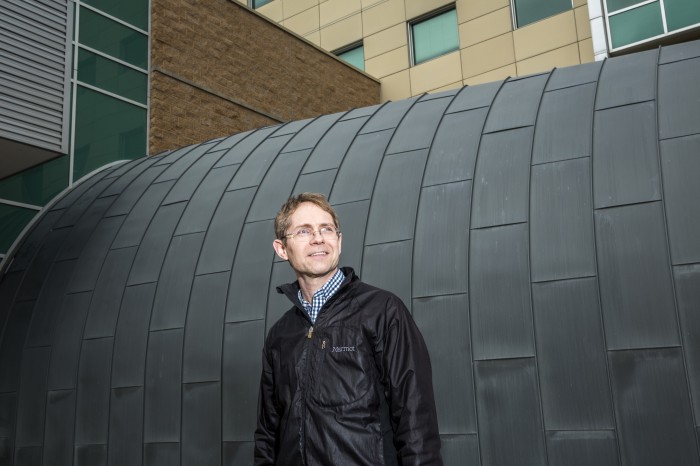
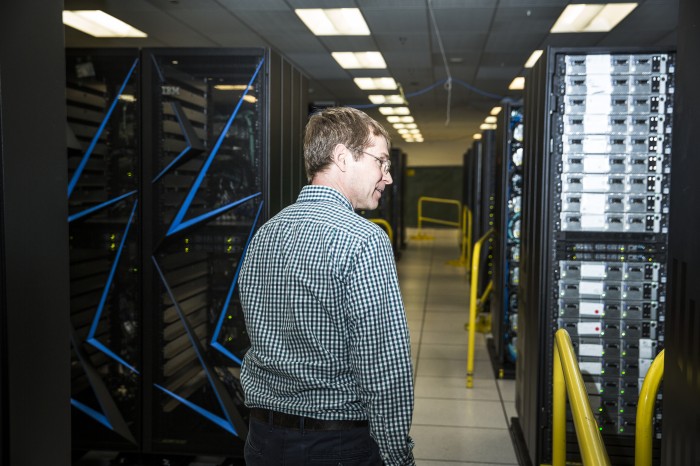
That event specifically caught the attention of Donald Lucas, a research scientist at Lawrence Livermore. He was part of a team of climate researchers and nuclear weapons modelers at the lab who had previously collaborated on a three-year project to improve confidence levels in the results of climate simulations.
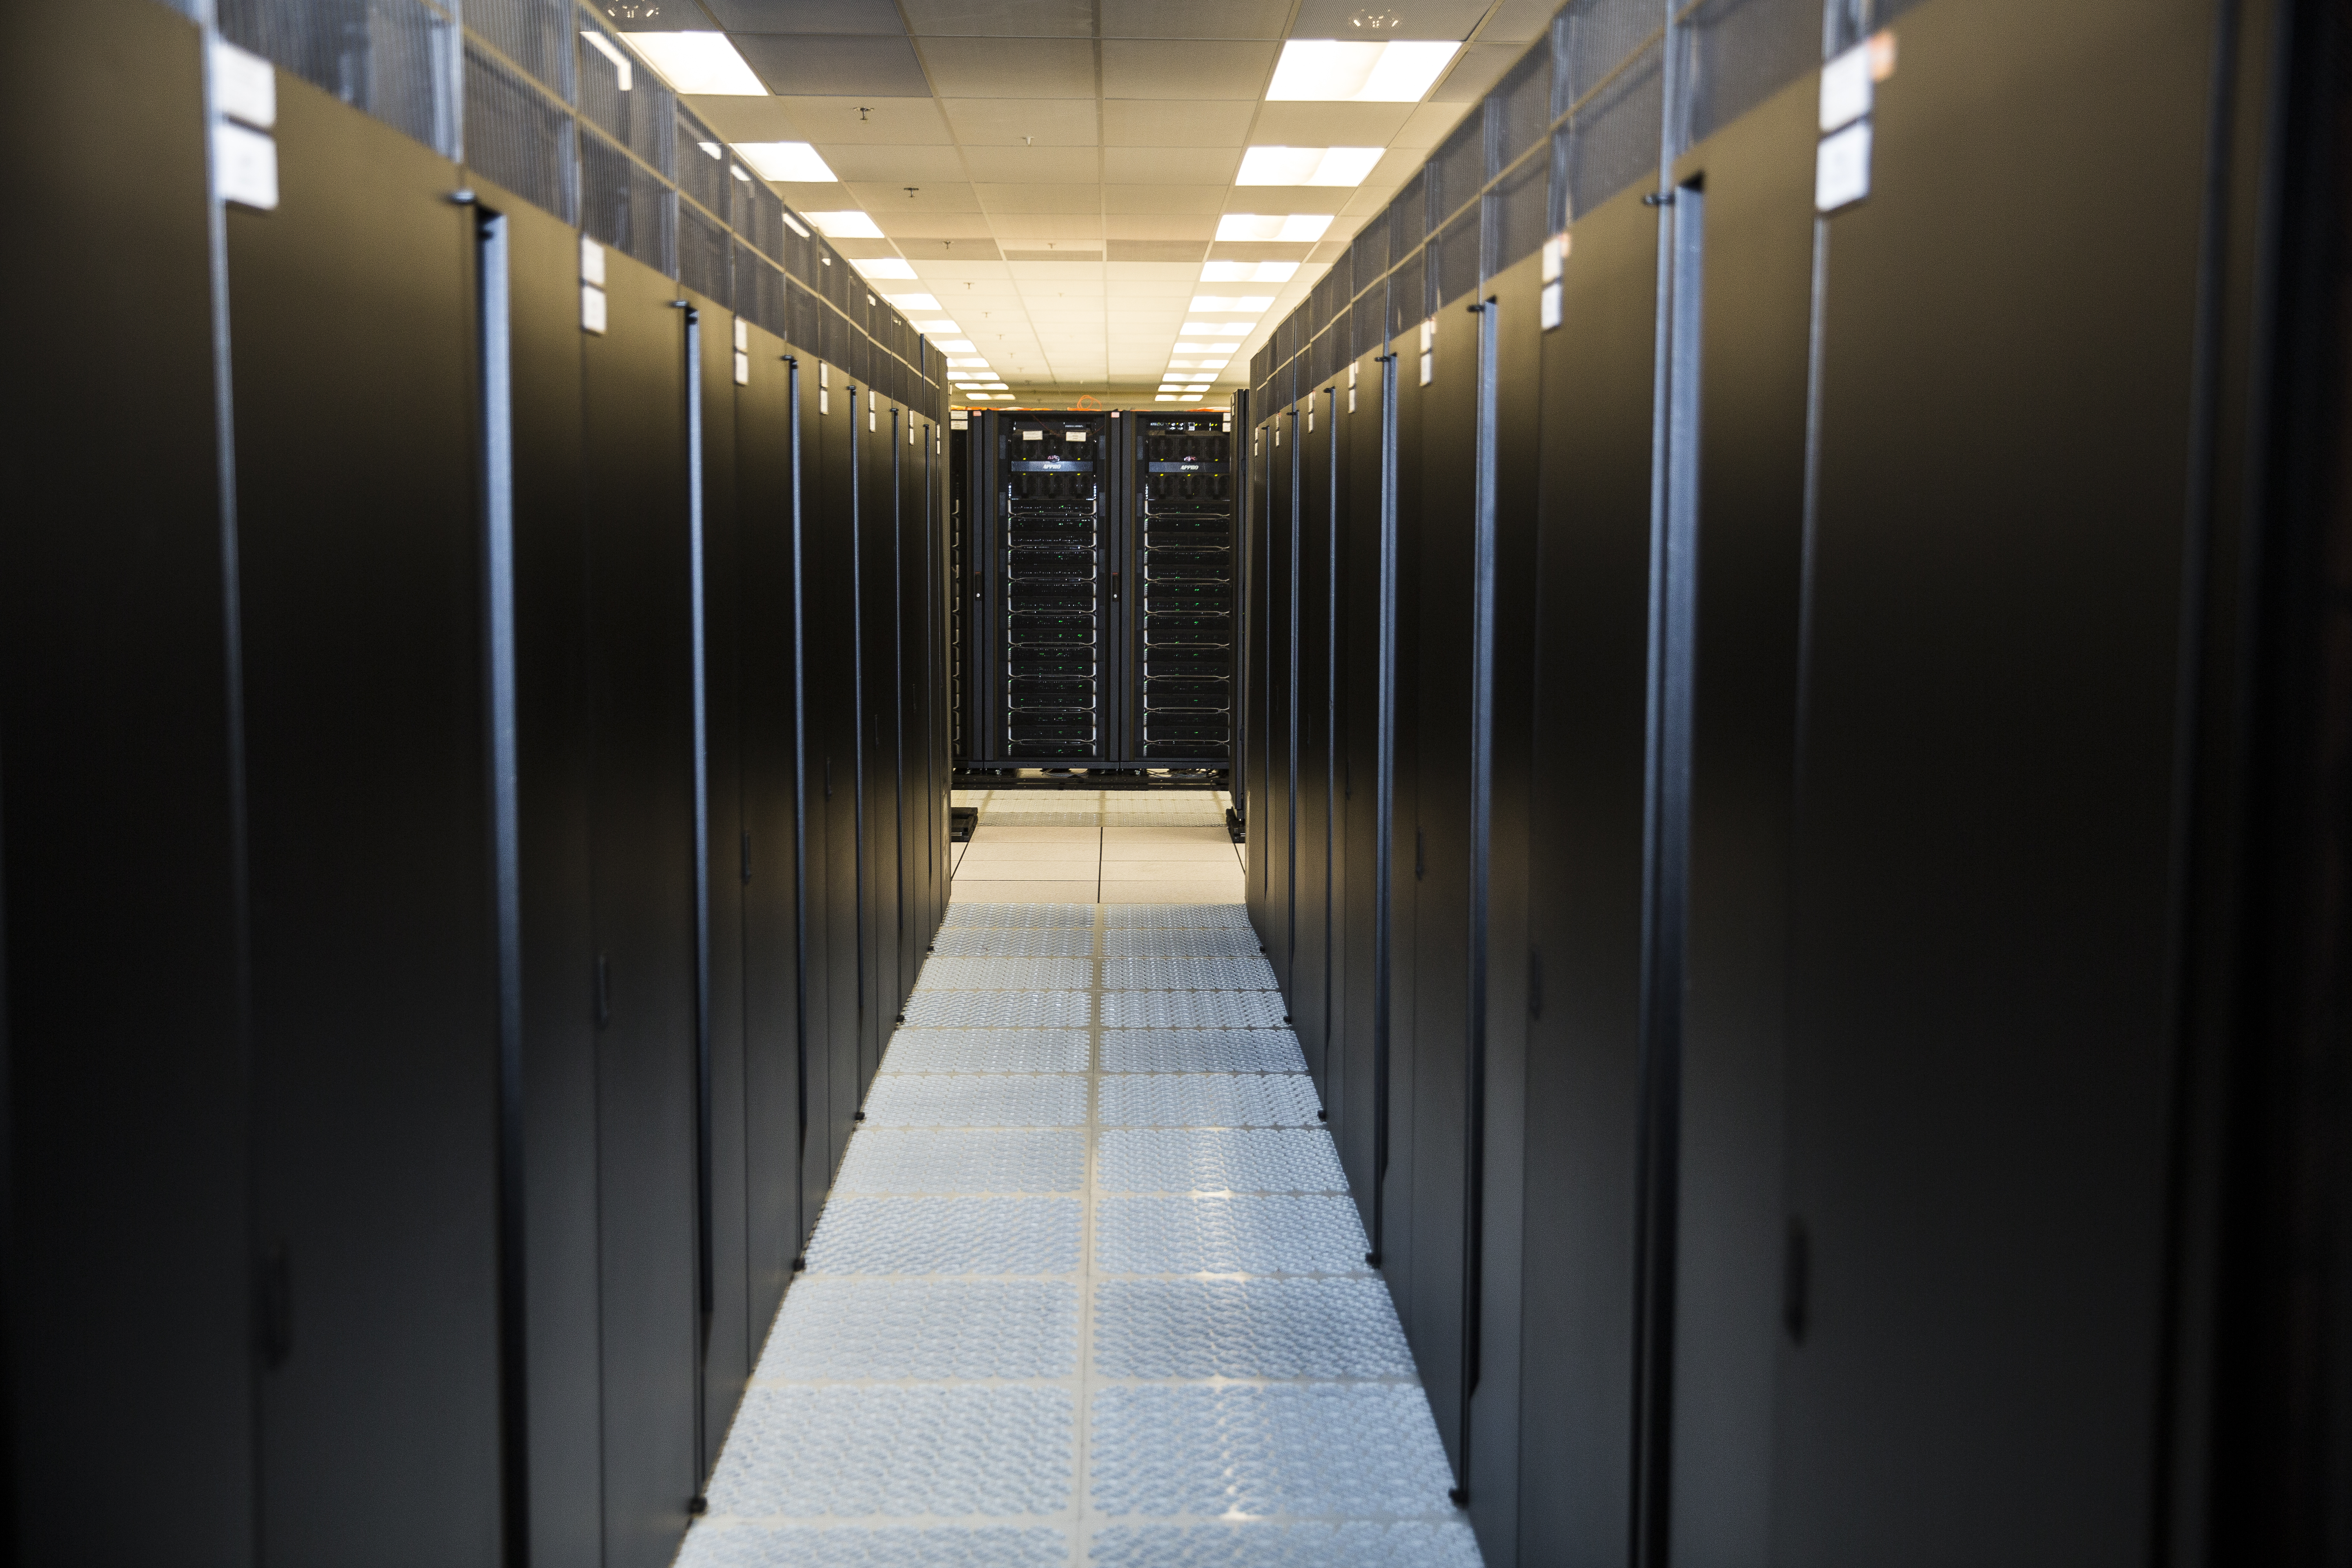
The US hasn’t conducted test explosions on nuclear weapons since 1992, so it has to rely on inspections and modeling to assess the reliability of the aging stockpile. Lawrence Livermore scientists have long used the lab’s supercomputers to simulate the degradation of materials, like plutonium, and helped develop new ways to compute certainty levels.
Instead of running a simulation once, they repeat it many times, slightly adjusting certain variables to produce an array of possibilities. From there, the researchers can calculate the statistical likelihood of certain outcomes based, in part, on how often they occur in results and how well they match up with data from physical inspections.
“You go back and flip the coin again,” Lucas explains. “You do that multiple times and you build up a distribution of the probability of the output.”
He and his colleagues decided to apply the same approach to climate models, writing programs to tweak dozens of parameters in the source code of a public climate model. They harnessed about half of a supercomputer at Lawrence Livermore for nearly three years, producing 100,000 years of simulations across a wide array of climate scenarios.
But in the summer of 2012, Lucas realized even those results had fallen well short of predicting the loss of Arctic sea ice that actually occurred. So he and colleagues undertook another modeling experiment, focused on sea ice. By consulting with experts on what variables could be at play and changing those parameters, his team was able to simulate the disappearance of far more Arctic sea ice, coming much closer to reality.
Three variables accounted for 95 percent of the change. Two of them specified the size of snow particles on sea ice, which affects how much sunlight is reflected away. The last one, known as the “thermal conductivity of snow,” essentially defines how fast heat can move through ice. Like the other two variables, it is normally treated as a constant in the dedicated ice model the team used. But in this case, the researchers toggled it within a range that reflected its real-world variability.
Lucas stops short of saying they’ve pinpointed the missing puzzle pieces in sea ice models. But by allowing for a range of “plausible” variations, “we find that we can explain most, but not all, of the differences between observations and [sea ice model] simulations,” he said in an e-mail.
The perfect setup
The experiment also created a much finer tool for Cvijanovic to explore the question she’d long pondered: Why did ancient periods of rapid warming in the Northern Hemisphere, known as Dansgaard–Oeschger events, seem to coincide with dramatic precipitation shifts all the way down in the tropics?
Toward the end of her PhD work at the University of Copenhagen, in 2011 and 2012, Cvijanovic was part of a modeling group that tried to make sense of these abrupt climatic changes evident in Greenland ice core samples.
She had made some crude attempts to explore these connections by adding energy fluxes in simulations, which essentially cranked up sea ice loss in artificial ways. But her colleague’s work at Lawrence Livermore enabled her to model extreme ice loss in a more realistic manner, by tweaking parameters within what’s considered the possible level of variation in nature.
“That was that perfect setup,” she says. “You’re not doing anything unphysical; you’re not cheating to observe this sea ice loss.”
Cvijanovic focused on the three variables that Lucas’s work found had the most powerful effects. She ran the model several dozen times, ultimately cranking up those variables to the far end of their ranges. It sometimes took an entire week to run a single analysis on the supercomputers at Lawrence Livermore, so the process took months. But eventually a clear picture began to form.
With little ice to reflect heat back into space, the region steadily warms. A small amount of that additional heat reaches the tropics, but it’s enough to trigger changes in wind and precipitation that alter convection and circulation patterns. These, in turn, produce massive waves of high- and low-pressure areas in the atmosphere, building up a persistent ridge that lands in the North Pacific. That feature steers storms north, away from California and toward Alaska and Canada.
It was a difficult experiment that depended on years of collective improvements in climate-modeling technology and techniques. More work is required to test the findings, and determine how other processes may magnify or diminish the effect of melting Arctic sea ice, other scientists say. But the simulation provided some of the first real evidence of the theorized connection between ice loss and distant droughts, and it sounded a stark warning about California’s looming dangers.
Deep Dive
Climate change and energy
The problem with plug-in hybrids? Their drivers.
Plug-in hybrids are often sold as a transition to EVs, but new data from Europe shows we’re still underestimating the emissions they produce.
Harvard has halted its long-planned atmospheric geoengineering experiment
The decision follows years of controversy and the departure of one of the program’s key researchers.
Why hydrogen is losing the race to power cleaner cars
Batteries are dominating zero-emissions vehicles, and the fuel has better uses elsewhere.
Decarbonizing production of energy is a quick win
Clean technologies, including carbon management platforms, enable the global energy industry to play a crucial role in the transition to net zero.
Stay connected
Get the latest updates from
MIT Technology Review
Discover special offers, top stories, upcoming events, and more.