There’s enough frozen water in Greenland to raise global sea levels seven meters, and enough in Antarctica to raise levels 65 meters. But the rate of melting is poorly understood, partly because ice-sheet surfaces look so inscrutably white and featureless in ordinary satellite images and to the human eye. Now, a new image-processing technique gives a clearer view of critical features of inland ice.
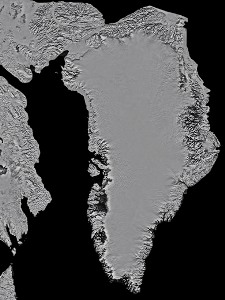
The technology starts with as many as 94 red and infrared images of the same region, taken by two NASA satellites, Terra and Aqua, with orbits that cross Greenland several times a day. By aligning and averaging values within areas of pixel overlap, researchers tightened resolution from 250 meters per pixel to as little as 150 meters, says Ted Scambos, the lead scientist and glaciologist at the National Snow and Ice Data Center at the University of Colorado at Boulder, who was one of the developers. The new approach also allows rapid reëvaluation of the entire ice sheet overlying Greenland to detect important short-term changes. “What we’ve got is a map that shows details much further inland, much better than before,” says Scambos. “Other images just show the interior of the ice sheet as a blank white surface.” Mark Fahnestock, a geologist at the University of New Hampshire in Durham who collaborated with Scambos, says the technology is key to understanding today’s accelerating ice-sheet melting.
Keep Reading
Most Popular
Large language models can do jaw-dropping things. But nobody knows exactly why.
And that's a problem. Figuring it out is one of the biggest scientific puzzles of our time and a crucial step towards controlling more powerful future models.
How scientists traced a mysterious covid case back to six toilets
When wastewater surveillance turns into a hunt for a single infected individual, the ethics get tricky.
The problem with plug-in hybrids? Their drivers.
Plug-in hybrids are often sold as a transition to EVs, but new data from Europe shows we’re still underestimating the emissions they produce.
Stay connected
Get the latest updates from
MIT Technology Review
Discover special offers, top stories, upcoming events, and more.