What Data Analysis Tells Us About the U.S. Presidential Election
A data-based assessment of online sentiments and articles on the U.S. presidential debates reveals deep divisions among voters—and indicates that negative news about the candidates has done little to change many voters’ minds.
In the fall of 2016, U.S. voters were gearing up for perhaps the most contentious presidential election ever. Democracy often tends to be a loud and raucous affair, but the partisan rancor that has defined the public discourse this time is on a whole different level. In the 2000 Presidential election cycle, 29 percent of voters identified as “independent,” according to a study by Pew Research. According to a recent poll by Gallup, that percentage is now at a stunning 42 percent, compared to 26 percent for Republicans and 29 percent for Democrats.
From charges of sexual harassment to sensational WikiLeaks revelations linked to hacks of the Democratic National Party and alleged attempts by foreign powers to meddle in the electoral process, there’s more drama in this election than a prime-time mini-series. And that is where reality begins to blur for an average voter: When every piece of media coverage is viewed from the lens of an individual’s political affiliation, how do we begin to gauge the mood of the nation? Are we really as fractured a nation as Twitter feeds might lead us to believe? And is there any hope for reconciliation once the hype cycle subsides?
Advertisement
We at SAP Startup Focus wondered whether we could analyze all the sentiments people were expressing online in both traditional and social-media channels, and use these to make a data-based assessment that might provide clues about answers to some of these questions.
This story is only available to subscribers.
Don’t settle for half the story.
Get paywall-free access to technology news for the here and now.
Semantic Visions, a Czech Republic-based startup that has the world’s largest semantic news database, recently conducted just such an analysis. Its researchers focused their analysis to the time period around the three national presidential-candidate debates held by mid-October, analyzing in the process more than 3 million articles across 275,000 sources. What the Semantic Visions analysis reveals is quite compelling or distressing, depending upon your perspective.
What Researchers Measured
At this point, it’s important to understand the methodology Semantic Visions used for this analysis. Researchers analyze content published by various online news, political, business, or general media sites, taking particular note of the who, what, when, where, why, and how. They analyze real articles and not just voter tweets, because an average article length of more than 3,100 characters provides more substance and context than can be had analyzing tweets averaging 70 to 120 characters long.
In this way, Semantic Visions’ methodology takes the pulse of Facebook and Twitter users by using the collective intelligence of hundreds of thousands of writers and editors who decide what is important to their readers—and what isn’t. According to the company’s technical experts, there is a strong correlation between public opinion and the conclusions determined by such semantic analysis.
Their sentiment analysis detects positive, negative or neutral opinions, tones, and events in text. It goes far beyond a simple matching of “good” or “bad” words from a list. The system evaluates sentiment by using a multi-tier ontology—that is, a formal structure that names and defines the types, properties, and inter-relationships of entities relevant to a particular domain of discourse. Each ontology node contains more than 1,000 elements that include attributes such as:
Linguistic functions. This includes analysis of word roots, parts of speech, syntax, verb tenses, and word formations.
Semantic representations. This includes synonyms, hyponyms, terms versus common words, and variants of names.
Semantic definiteness. Words with multiple meanings are taken into account and differentiated according to context.
Intensity. Words have different “weights” and are ordered by their expressive power—for example, from a subtly negative word to a clear obscenity.
Number and relevance of occurrences. The system differentiates whether the detected sentiment applies to the article in general or to a specific person. If multiple persons or entities are mentioned, it detects and appropriately assigns the sentiment for each of them correctly.
Following is the analysis for each of the three debates:
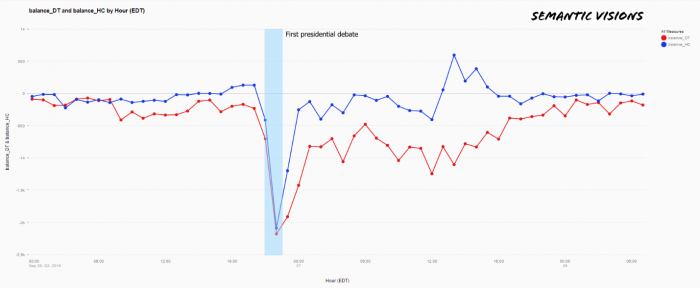
Debate 1 : Monday, Sept. 26, 2016
In real time, Semantic analyzed 1,107,266 articles published in more than 275,000 sources in the 54-hour time period from midnight ET on Sept. 26 to 8 a.m. ET on Sept. 28. According to most pundits, Democrat Hillary Clinton won the first presidential debate over Republican Donald Trump. However, what the data are showing is something slightly more nuanced. Even though the media sentiment regarding both candidates dropped during the debate, within the following 18 hours, it was nearly back to the baseline set 12 hours before the debate.
In other words, regardless of which candidate the pundits deem won the debate, no minds were significantly changed and the fractured electorate basically went back to partisan positions once the fact-checking and the name-calling ended.
Advertisement
Debate 1: The blue vertical bar is the actual 90-minute segment of the debate itself.
Source: Semantic Visions. Used with permission.
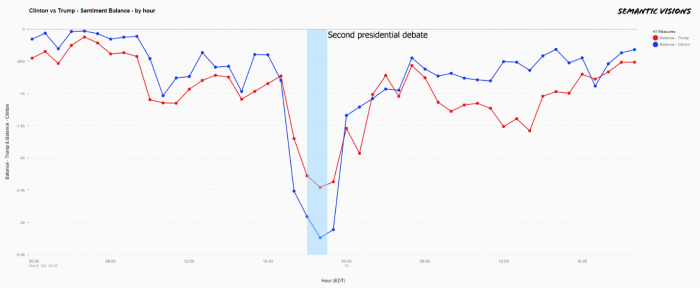
Debate 2: Sunday, Oct. 9, 2016
For the second presidential debate, Semantic Visions analyzed 971,939 articles published in more 275,000 sources in the 48-hour time period from midnight ET on Oct. 9 to midnight ET on Oct. 11. This debate was defined by character attacks and, according to FactCheck.org, included a “mountain of false and misleading statements” on both sides. Once again, you might think that some positions might change. But alas, this was not the case. The analysis shows a few things:
Both candidates have plenty of negative sentiments associated with them.
Trump was on the defensive this time due to revelations that had surfaced a few days earlier about sexually charged comments that he had made. As a result, there was a lot more engagement, as measured by the articles published online and the sentiments revealed by analysis, than in the first debate. We see that the sentiment balance was in the negative to the tune of 3,000-plus references per hour, as compared to about 2,000 references per hour during the previous face-off.
Even so, Clinton still had more negative sentiment associated with her than Trump did during the actual debate, which perhaps is an indication of the uphill battle she faced with respect to her credibility and trust with the general public.
Less than 24 hours after the debate ended, both candidates were right back to their baseline positions in terms of public perception—meaning that, again, this debate didn’t change many minds.
Debate 2: The blue vertical bar is the actual 90-minute segment of the debate itself.
Source: Semantic Visions. Used with permission.
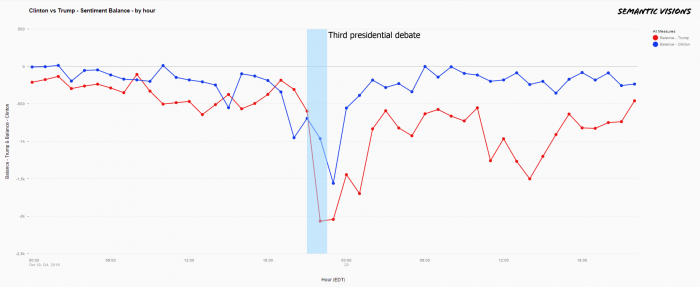
Debate 3 : Wednesday, Oct. 19, 2016
For the third presidential debate, Semantic Visions analyzed 1,051,154 articles published in more than 275,000 sources in the 48-hour time period from midnight ET on Oct. 19 to midnight ET on Oct. 21.
This debate was at least as acrimonious as the prior two debates, and it was notable for Trump’s refusal to commit to accepting the results of the election if he lost, thereby challenging a cornerstone of American democracy. Before the 90-minute exchange was over, the hash tags “bad hombres” and “nasty woman” had become hot Internet memes. In the analysis, we see the same trend as in the previous two instances: During the debate, media sentiments for both dropped, but both quickly returned to where they started in terms of popular perception.
ebate 3: The blue vertical bar is the actual 90-minute segment of the debate itself.
Source: Semantic Visions. Used with permission
Conclusion
What this analysis reveals shouldn’t surprise anyone who has been watching the U.S. presidential-election scene. While your individual worldview may be impacted by the specific media outlets you favor, at an aggregate level, the data are confirming that the U.S. electorate is indeed deeply split and that voters’ positions have hardened regardless of the results of the debates or negative news stories about the candidates.
After the second debate, it was pretty clear that, in Trump supporters’ minds, the candidate could do no wrong—offensive comments or not. And despite being a master of facts and policy positions, Clinton was still having trouble connecting with her constituents. If anything, in this election cycle the debates may not be changing many—or any—minds, as evidenced by the fact that the sentiment balance shifted back to its pre-debate position within 12 to 18 hours after each debate.
Going into the final two weeks before the election, it’s clear that the outcome won’t necessarily hinge on the candidate’s experience, tax returns, deleted e-mails, or any other such factors. Instead, it might simply come down to who can deliver enough of his or her base to show up to the polls. When the electorate is as divided as the United States is right now, every single vote matters. After all, in the 2000 presidential election, it was the 537-vote win in Florida that enabled George W. Bush to beat Al Gore, even though the latter had received more than 540,000 of the total popular votes.
Manju Bansal is vice president and global program head at SAP Startup Focus, which works with startups in the big data and predictive or real-time analytics space, supporting them in building innovative applications that use the SAP HANA database platform. The program serves more than 4,300 companies in the program, including Semantic Visions. Join the conversation on Twitter at @SAPStartups or follow the author: @BansalManju.