Network science reveals the secrets of the world’s best soccer team
One of the best soccer teams in history is widely acknowledged to be the Barcelona side that played during the 2009-10 season. Under the inspirational leadership of manager Pep Guardiola, this team won six major competitions including the Spanish football league, known as La Liga, and the UEFA Champions League, the most prestigious competition in world football. No other team has accumulated so many trophies in such a short period
Guardiola’s teams play a unique style of football, and Barcelona embodies it. The team aimed to maintain possession of the ball, making short, rapid passes between closely spaced players and then immediately pressing the opposition when possession was lost. This type of football is known variously as tiki-taka or total football, and no team has mastered it like Barcelona.
But while the strategy can be described in broad terms, sports analysts are interested in capturing it via the data that analytics companies routinely collect.
By the conventional metrics—number of goals, passes, shots, and points—Barcelona clearly outstrips its competitors. But these metrics do not capture the style of play. So sports analysts would dearly love to find a way to characterize the huge difference in play between Barcelona and other teams.
Enter Javier Buldú at the Universidad Rey Juan Carlos in Spain and a number of colleagues, who have used network science to capture Barcelona’s style. “We combine the use of different network metrics to extract the particular signature of the F.C. Barcelona coached by Guardiola, which has been considered one of the best teams along football history,” they say.
Using network science to study sports is a relatively recent approach. The idea is to represent each player in a team as a node and create a link between players whenever they pass to each other. As the number of passes increases, the link becomes stronger. The data also includes the position of each player when a pass is made. By the end of the game, this network is a powerful record of the links between players and the way the game has evolved.
But much more is possible: researchers in other disciplines have used network science to study the internet, the spread of disease, forest fires, and even the emergence of war. Sports scientists can use these powerful mathematical tools to analyze the nature of a team’s network and the most important nodes within it.
Various researchers have already applied this approach to football. They have found that the networks form “small worlds” (in other words, it is possible to cross the network in a much smaller number of links than there are players in the team); that certain players are more “central” than others (in other words, the ball is much more likely to be passed to and from them); and that certain patterns of play, or “motifs” are common, such as playing the ball between three players forming a triangle.
Buldú and colleagues take this approach a step further. Instead of looking at the network from the entire game, they have analyzed the way it changes throughout each game. They do this by generating the network created by the first 50 passes and then using a sliding window to see how this network changes as the game evolves. This means adding the 51st pass to the network while taking away the first pass, and so on.
This gives an insight into the way play changes throughout the game.
They first generate passing networks for both teams in every La Liga game played in the 2009-10 season. That’s 380 games played between the 20 teams in the top tier of the Spanish national league.
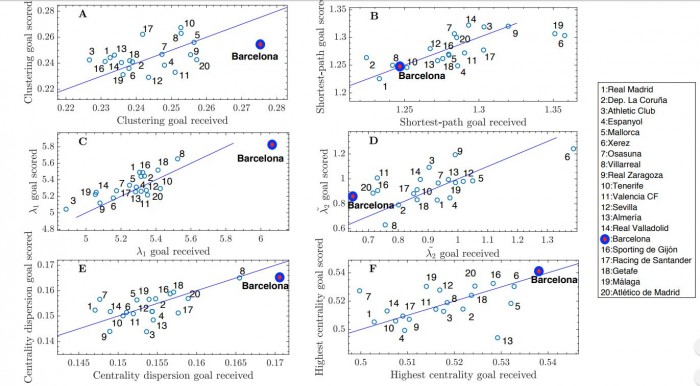
They then calculate a number of well-understood network features for each team. These measures included the clustering coefficient, which describes how well triplets of players pass to each other and is much higher for Barcelona than any other team; the average shortest path through the network, which describes how well the ball is passed across the team and is much shorter for Barcelona than any other team; and the largest eigenvalue of the connectivity matrix, which measures the strength of the network and is higher for Barcelona than any other team.
Buldú and colleagues look at how the network evolves over time using the 50-pass networks. “We are able to identify those network metrics that enhance the probability of scoring/receiving a goal, showing that not all teams behave in the same way and how the organization Guardiola’s F.C. Barcelona is different from the rest,” they say.
This reveals, for example, how a team’s centroid—its average position on the field—changes over time. By this measure, Barcelona plays further up the pitch than most other teams (only Real Madrid overtakes it towards the end of games). Barcelona’s centroid is also more stable than other teams’.
The ratio of advance measures how likely the team is to pass forwards, backwards, or horizontally across the pitch. Again Barcelona is unusual, in that its passes are more likely to be horizontal than any other team’s. This reflects the strategy of passing the ball back and forth across the pitch looking for opportunities to attack.
Barcelona also has the highest centrality of a single player in Xavi, who is widely acknowledged to have been one of the best midfielders of all time.
But the analysis reveals some weaknesses too. The likelihood that Barcelona will concede a goal increases when the dispersion of players around the team’s centroid increases—in other words, when the players spread out. That suggests an Achilles’ heel that other teams could attempt to exploit.
Curiously, other teams do not behave in the same way. Valencia, for example, is more likely to score a goal when the dispersion around its centroid increases.
That’s a fascinating set of insights revealing many of the playing patterns that make Barcelona unique.
Of course, this kind of analysis isn’t a magic wand that other teams can use to copy Barcelona’s success. It is one thing to identify promising patterns of play but quite another to reproduce them in practice.
Barcelona’s playing style is the result of a training program that stretches throughout the club, even into its youth academy. Indeed, seven of the 10 players who played more than 1,000 minutes during the 2009-10 season came through the club’s youth academy.
It will take significant time and investment to repeat this success elsewhere. But that’s exactly what Guardiola appears to be doing at his current club, Manchester City, which has dominated the English Premier League for several seasons. It’d be interesting to see whether Buldú and colleagues can identify Guardiola’s signature patterns of play in this team as well.
Beyond this, there are plenty of ways to develop the network science approach further. One possibility is to look at how individual players influence games, how a change in their position can influence their performance, and so on. And it is not just soccer that can benefit—the same approach can be applied to almost any team sport. Clearly network science has a bright future for sports analysts.
Ref: arxiv.org/abs/1909.08903 : Defining a historic football team: Using Network Science to analyze Guardiola’s F.C. Barcelona
Deep Dive
Humans and technology
Building a more reliable supply chain
Rapidly advancing technologies are building the modern supply chain, making transparent, collaborative, and data-driven systems a reality.
Building a data-driven health-care ecosystem
Harnessing data to improve the equity, affordability, and quality of the health care system.
Let’s not make the same mistakes with AI that we made with social media
Social media’s unregulated evolution over the past decade holds a lot of lessons that apply directly to AI companies and technologies.
Stay connected
Get the latest updates from
MIT Technology Review
Discover special offers, top stories, upcoming events, and more.