Grocery bills can predict diabetes rates by neighborhood
In 1826, the French gastronomer Jean Anthelme Brillat-Savarin published a book called The Physiology of Taste. The work is famous for introducing the aphorism “Tell me what you eat and I will tell you what you are”—the origin of the saying “You are what you eat.”
Brillat-Savarin would no doubt have much to say about the increasingly obese, hypertensive, and diabetic citizens of the developed world. In the US, 36% of adults and 17% of children are obese. In Europe, some estimates suggest, 50% of the population will be obese by 2050.
Food is an important factor in this state of affairs. So researchers desperately want to know more about dietary habits and how they relate to health.
But teasing apart people’s eating habits is a surprisingly tricky business. Much of the work in this area is based on relatively small studies. Researchers have also tried to infer what web users eat. But critics say this approach is plagued by biases and so cannot reliably capture dietary habits.
So a better way of studying eating patterns and their health effects is desperately needed.
Enter Luca Maria Aiello at Nokia Bell Labs in Cambridge, UK, and colleagues, who have studied diet by mining the data from grocery bills and then comparing it with the population’s health, as determined by medical prescriptions issued in the area.
The power of their approach comes from the sheer scale of the work. The grocery bills come from Tesco, Britain’s largest grocery chain. This company’s database contains every single food item purchased in London stores during 2015.
The medical data is a publicly available data set of every single prescription written by general practitioners in London during 2016. “The scale and granularity of our analysis is unprecedented,” say Aiello and co.
Tesco has 411 shops in London used by 1.6 million customers with loyalty cards, who bought 1.6 billion food items in 2015. The data set includes each item, its weight, the date, and the customer’s postcode.
Aiello and co extracted the nutrition content for each item, including total energy, fats, saturated fats, carbohydrates, and so on. They used this to work out the average nutritional intake for 937 neighborhoods in London.
The medical prescription data is also available at that neighborhood level. Londoners were prescribed 1.1 billion medicines in 2016, from which the team inferred the conditions they suffered. The researchers were particularly interested in the prevalence of “metabolic syndrome” conditions, which are characterized by high blood pressure, high cholesterol levels, and high blood sugar levels (diabetes). The data revealed the distribution of these conditions across the city.
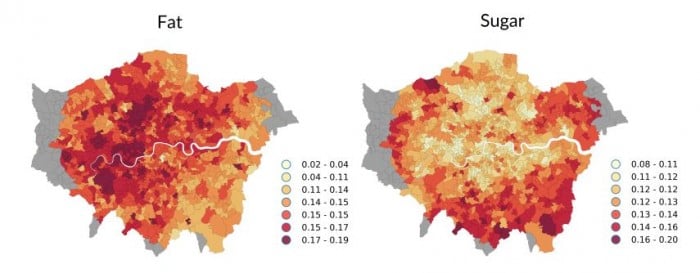
Finally, the team compared the data sets to see how nutrition correlates with metabolic syndrome conditions and then mapped out the results across the city.
These maps make for interesting browsing. They show, as expected, that increased consumption of carbohydrates, fat, and sugar is positively correlated with metabolic syndrome, while increased fiber intake is negatively correlated. They go on to show that item weight—which is a proxy for calorie consumption—is also positively correlated with metabolic illness, while greater diversity of nutrients is negatively correlated.
There are also important differences between London neighborhoods. The wealthy and highly educated residents of the City of London and Chelsea consume more fiber and have greater nutrient diversity.
By contrast, residents of Newham, a relatively deprived neighborhood, consume more calories and less diverse nutrients, and they have higher levels of diabetes.
But healthy areas are not necessarily well off. “The residents of Hackney, which is a deprived yet highly-educated neighbourhood in East London, enjoy healthier eating habits and do not suffer from diabetes as much as Newham’s residents,” say Aiello and co.
The team go on to predict the levels of high blood pressure, high cholesterol, and high blood sugar in a neighborhood merely by looking at the local calorie and nutrient consumption. Indeed, they say their classifier can identify unhealthy areas with an accuracy of 91%.
That’s interesting work that has important implications for the way health providers, policy makers, and even insurance companies assess health. “Our study shows that analytics of digital records of grocery purchases can be used as a cheap and scalable tool for health surveillance,” say Aiello and co. Brillat-Savarin would surely be amazed.
Ref: arxiv.org/abs/1905.00140 : Large-Scale And High-Resolution Analysis Of Food Purchases And Health Outcomes
Deep Dive
Policy
Is there anything more fascinating than a hidden world?
Some hidden worlds--whether in space, deep in the ocean, or in the form of waves or microbes--remain stubbornly unseen. Here's how technology is being used to reveal them.
A brief, weird history of brainwashing
L. Ron Hubbard, Operation Midnight Climax, and stochastic terrorism—the race for mind control changed America forever.
What Luddites can teach us about resisting an automated future
Opposing technology isn’t antithetical to progress.
Africa’s push to regulate AI starts now
AI is expanding across the continent and new policies are taking shape. But poor digital infrastructure and regulatory bottlenecks could slow adoption.
Stay connected
Get the latest updates from
MIT Technology Review
Discover special offers, top stories, upcoming events, and more.