Mathematical Model Reveals How French Riots Spread via a Giant Wave of Contagious Violence
Clichy-sous-Bois is a deprived area of northeast Paris where youth unemployment is rampant, racial tensions are high, and relations with the police are poor. It is a typical “banlieue,” or suburb, of a large metropolitan city.
On October 27, 2005, police received reports of a burglary at a building site in the area where youths had gathered. The arrival of investigating officers caused the youths to scatter. Two sought refuge in an electricity substation, where they were electrocuted.
The incident triggered an extraordinary series of events. The deaths raised local tensions, and violence erupted with rioters torching cars and public buildings.
The disruption did not stop there. During subsequent nights, the rioting spread to other Parisian suburbs and other French cities. One night, more than 1,000 cars were set alight across the country. The violence lasted three weeks in total.
Undoubtedly, one of the causes was the severe inequality that many young people experience in parts of France, particularly those from immigrant families. Similar circumstances have triggered unrest in many places.
However, the French unrest differed in an important way from other riots, such as those in England in 2011, when rioters moved from one area to another spreading violence as they moved.
In Paris, however, the rioters were confined to specific areas. And that raises an interesting question. How did the violence spread across the city and across the entire country?
Today we get an answer of sorts thanks to the work of Laurent Bonnasse-Gahot at the PSL Research University in Paris and a few pals who have modeled the events to reveal the forces at work. These guys show that the rioting spread like a wave through French society, suggesting that geography plays a much larger role in the spread of violence than had previously been thought.
The team began with a massive database of all the daily crime reports recorded at police stations in more than 800 municipalities across France. This provides a comprehensive time line of events during the riots. “We thus get a data set composed of the number of riot-like events for each municipality, every day from October 26 to December 8, 2005, a period of 44 days, which covers the three weeks of riots and extends over two weeks after,” say Bonnasse-Gahot and co.
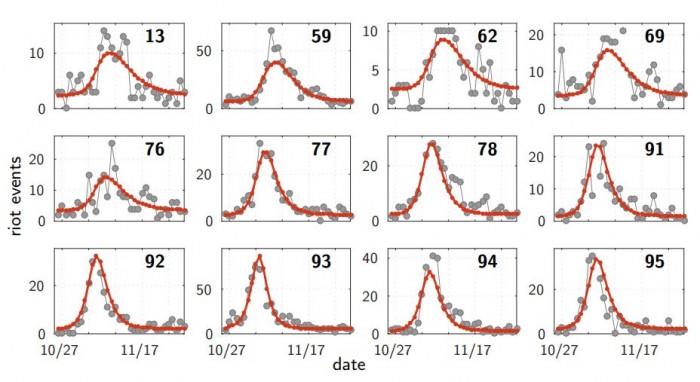
This data set reveals some curious similarities between the riots in each location. For a start, the rioting seems to spike at a specific time, and then activity returns to the same background levels of violence that existed before. These spikes take the same shape even though they have a variety of amplitudes. And the same shape appears at all locations.
For Bonnasse-Gahot and co, the task is to find the simplest mathematical model that reproduces this behavior in all the 800 municipalities. They use a susceptible-infected-recovered model, more often used to describe the spread of disease.
In this model, an episode begins with a certain number of susceptible individuals, some of which become “infected” and begin to riot. Rioters then leave this infected population as they stop rioting due to fear, fatigue, being arrested, and so on. Bonnasse-Gahot and co assume this happens at a constant rate.
They also assume that these “recovered” individuals are no longer susceptible to rioting again, since the evidence suggests that once a riot has ended in particular area, it does not flare up again. Assumptions like this place powerful mathematical limits on the behavior of the model, and this accurately simulates the single spike shapes that the data shows.
Next, Bonnasse-Gahot and co model how rioting spreads from one region to another. They do this by assuming that susceptible individuals become more likely to riot if there is another riot nearby; and the closer the trouble, the stronger the influence.
To kick off a simulation, the team has to put some numbers into the model. In particular, they need a susceptible population to start with. In this case, Bonnasse-Gahot and co choose men aged between 16 and 24 who are out of school and have no diploma. In other words, disaffected youths and those likely to be unemployed. They then set the model running.
The results make for interesting reading. The model immediately reveals how the violence propagates around Paris in a wave of rioting. “We give a precise mathematical characterization to the expression ‘wave of riots,’ and provide a visualization of the propagation around Paris, exhibiting the wave in a way not described before,” say Bonnasse-Gahot and co. The team has produced a video to show how this happens.
The model reproduces the real-life behavior in considerable detail and shows that geography plays a more important role than had been previously considered. “The remarkable agreement between model and data demonstrates that geographic proximity played a major role in the riot propagation,” they say.
In other words, if there is a riot nearby, people become more likely to riot themselves.
Indeed, the model is so accurate that it predicts the expected number of events in all the relevant areas. However, it also predicted a flare-up in the municipality of Fleury-Merogis, which was not recorded in the data. However, Bonnasse-Gahot and co say a trawl through the police records revealed that a kindergarten had been torched at that time, but this was not recorded as a riot event.
That’s interesting work that provides some important insight into the way spontaneous unrest occurs. “Despite the modern communication media, physical proximity is still a major feature in the circulation of ideas, here of riotous ideas,” conclude Bonnasse-Gahot and co. In other words: geography matters.
The team says that the model shows that strong interpersonal ties are also important in the spread of unrest. “Human behavior is a consequence not only of individuals’ attributes but also of the strength of the relation they hold with other individuals,” say the researchers.
And finally, they point out that social inequality plays a crucial role, particularly when it becomes concentrated in specific locations, as was the case in the locations of the French riots.
All this is possible using a model that has only a handful of parameters that need to be fitted to the data. Bonnasse-Gahot and co say the simplicity of the model makes it applicable to other examples of spontaneous unrest.
They point to a similar wave-like pattern of behavior during ethnic riots in the U.S. and also during food riots in the U.K. in the late 18th century. That suggests an underlying process that is common to these examples of unrest that the model appears to catch. “We argue that our approach gives a general framework for the modeling of spontaneous collective uprisings,” say the researchers.
The real test, of course, will be whether a model like this can predict future riots. That’s a difficult task, though, and one that requires somebody to stick their neck out. Any takers?
Ref: arxiv.org/abs/1701.07479: Epidemiological Modeling of the 2005 French Riots: A Spreading Wave and the Role of Contagion
Keep Reading
Most Popular
Large language models can do jaw-dropping things. But nobody knows exactly why.
And that's a problem. Figuring it out is one of the biggest scientific puzzles of our time and a crucial step towards controlling more powerful future models.
The problem with plug-in hybrids? Their drivers.
Plug-in hybrids are often sold as a transition to EVs, but new data from Europe shows we’re still underestimating the emissions they produce.
Google DeepMind’s new generative model makes Super Mario–like games from scratch
Genie learns how to control games by watching hours and hours of video. It could help train next-gen robots too.
How scientists traced a mysterious covid case back to six toilets
When wastewater surveillance turns into a hunt for a single infected individual, the ethics get tricky.
Stay connected
Get the latest updates from
MIT Technology Review
Discover special offers, top stories, upcoming events, and more.