Mobile Phone Data Reveals Literacy Rates in Developing Countries
One of the millennium development goals of the United Nations is to eradicate extreme poverty by 2030. That’s a complex task, since poverty has many contributing factors. But one of the more significant is the 750 million people around the world who are unable to read and write, two-thirds of which are women.
There are plenty of organizations that can help, provided they know where to place their resources. So identifying areas where literacy rates are low is an important challenge.
The usual method is to carry out household surveys. But this is time-consuming and expensive work, and difficult to repeat on a regular basis. And in any case, data from the developing world is often out of date before it can be used effectively. So a faster, cheaper way of mapping literacy rates would be hugely welcome.
Today, Pål Sundsøy at Telenor Group Research in Fornebu, Norway, says he’s worked out how to determine literacy rates using mobile phone call records.
His method is straightforward number crunching. He starts with a standard household survey of 76,000 mobile phone users living in an unidentified developing country in Asia. The survey was carried out for a mobile phone operator by a professional agency and logs each person’s mobile phone number and whether or not they can read.
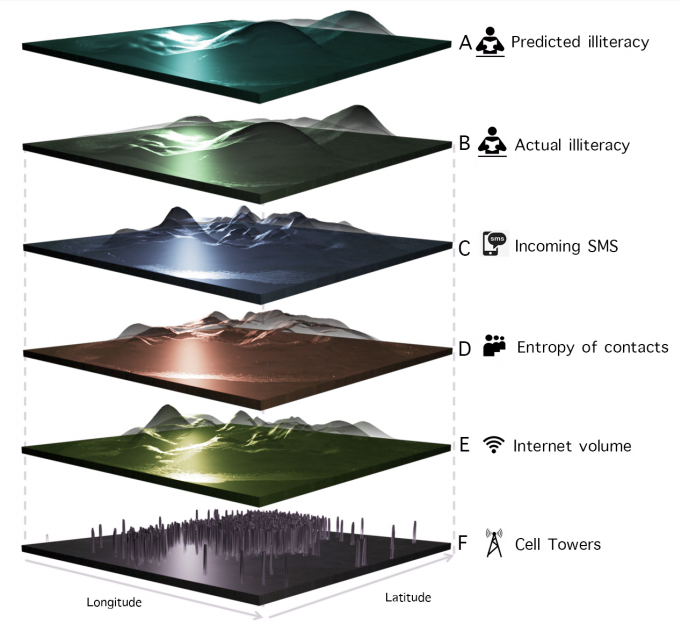
Sundsøy then matches this data set with call data records from the mobile phone company. This provides data such as the numbers each person has called or texted, the length of these calls, air time purchases, cell tower locations, and so on.
From this data, Sundsøy can work out where all the individuals were when they made their calls or texts, who they were calling or texting, the number of texts received, at what time of day, and so on. This allows him to construct a social network for each user, working out who they called, how often, and so on.
Finally, he used 75 percent of the data to search for patterns associated with users who are illiterate, using a variety of number crunching and machine learning techniques. He used the remaining 25 percent to test whether it is possible to use these patterns to identify illiterate people and areas where there is a higher proportion of illiterate people.
The results make for interesting reading. Sundsøy says that his machine learning algorithm has found several factors that seem to predict illiteracy. The most powerful is the location where people spend most of their time. “One explanation can be that the model catches regions of low economic development status, e.g. slum areas where illiteracy is high,” says Sundsøy.
Another predictor of illiteracy is the number of incoming texts and how they differ from the number of outgoing texts. That could be because people do not send texts to others who they know are illiterate, points out Sundsøy.
And the social network seems to be a useful indicator as well. “Illiterates tend to concentrate their communication on few people,” says Sundsøy. That’s in line with other work suggesting that economic well-being correlates with diversity among social contacts.
All in all, he says, his machine learning algorithm can spot illiterate individuals with surprising accuracy. “By deriving economic, social, and mobility features for each mobile user we predict individual illiteracy status with 70 percent accuracy,” he says, pointing out that this allows areas with low literacy rates to be mapped.
That could be a useful trick for aid agencies wanting to allocate resources to areas with low literacy rates. However, they will want better evidence that it works on other data sets and in other places.
If it does, the potential to improve lives is huge. Low levels of literacy lead to a vicious cycle of poverty. People who are functionally illiterate are unable to fill in job applications, read medicine labels, write checks, or balance their accounts.
This makes them more likely to be unemployed, to have poor health and to be dependent on social welfare or charity. Neither are they able to help their children learn to read and write.
Ending this cycle is an important goal.
All this is part of a bigger trend in using mobile phone records to study populations. For example, demographers have used the technique to map wealth distribution in Côte d’Ivoire on the west coast of Africa and say the method could one day take the place of censuses.
If these kinds of studies can be properly calibrated, they will be an addition the demographers’ armory. A real-time picture of a region’s socio-economic status will allow them to allocate resources as they are needed when problems emerge. That would be a powerful tool.
Ref: arxiv.org/abs/1607.01337: Can Mobile Usage Predict Illiteracy in a Developing Country?
Deep Dive
Policy
Is there anything more fascinating than a hidden world?
Some hidden worlds--whether in space, deep in the ocean, or in the form of waves or microbes--remain stubbornly unseen. Here's how technology is being used to reveal them.
A brief, weird history of brainwashing
L. Ron Hubbard, Operation Midnight Climax, and stochastic terrorism—the race for mind control changed America forever.
What Luddites can teach us about resisting an automated future
Opposing technology isn’t antithetical to progress.
Africa’s push to regulate AI starts now
AI is expanding across the continent and new policies are taking shape. But poor digital infrastructure and regulatory bottlenecks could slow adoption.
Stay connected
Get the latest updates from
MIT Technology Review
Discover special offers, top stories, upcoming events, and more.