Astronomers Create 3-D Printed Model of Colliding Stellar Winds
In 1843, a relatively unknown star in the constellation of Carina in the southern hemisphere suddenly erupted becoming the second brightest star in the sky after Sirius. This object, called Eta Carinae, gradually decreased in brightness until it faded from view entirely some 40 years later. Since then, it has varied in brightness in a rough a five-year cycle.
Eta Carinae is curious because this variation in brightness occurs over a wide range of wavelengths and timescales. In 1998, for example, it suddenly flared up and doubled in brightness.
The explosion in the 1840s left Eta Carinae surrounded by a spectacular cloud of dust known as the Homunculus Nebula. Astronomers have long known that this eruption did not destroy the star involved, which they thought must sit at the center of this cloud.
About 10 years ago, however, they discovered that this cloud contains two stars in a highly elliptical five-year orbit. This orbit, they decided, must be the cause of the periodic changes in brightness.
But exactly why Eta Carinae is so variable over such a wide range of wavelengths is something of a mystery. Today, Thomas Madura from the NASA Goddard Space Flight Centre in Greenbelt, Maryland, and a few pals provide a detailed insight into the nature of the star system using supercomputer simulations of the way they interact.
These simulations reveal never-before-seen details of the internal structure of the Homunculus Nebula. In addition, Madura and co display their data and interact with it in entirely new ways, including producing a 3-D print of the data, the first time this has been done with an astrophysical simulation.
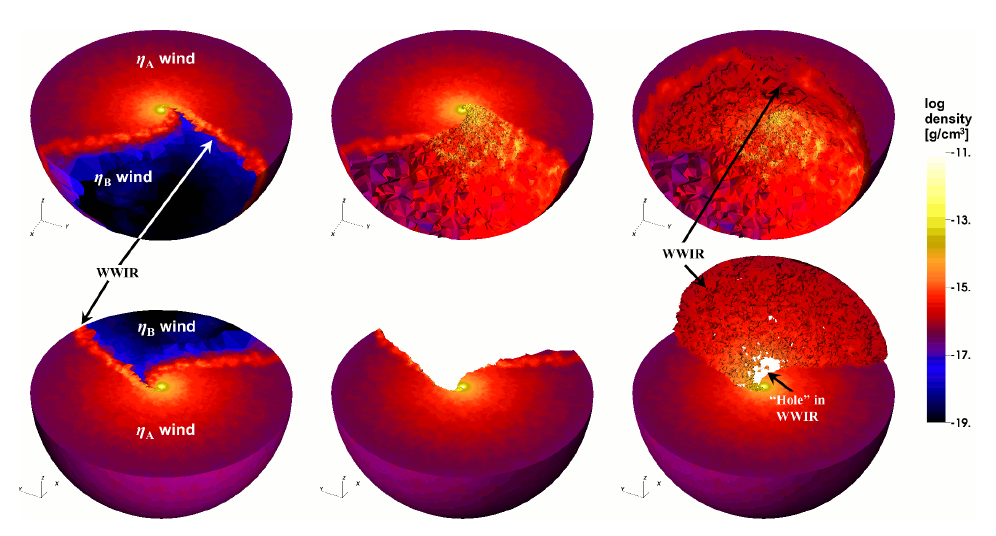
First, some background about the nature of Eta Carinae. Both of the stars in this system are huge, one about 30 times bigger than the sun and the other even larger, some 90 times the solar mass.
The larger of these, Eta A, produces a dense stellar wind, the densest ever observed in fact, and this streams away from the star at high speed. The second star produces its own stellar wind which interacts with the first as they orbit each other, particularly when they come close together. At closest approach, the stars are about as far apart as Mars is from the sun.
Astronomers think that much of the system’s strange behavior is the result of these powerful winds colliding. This collision creates a shockwave that generates intense bursts of x-rays and other wavelengths. But the shockwave must rotate as the stars orbit each other. What’s more, it must change in intensity as the stars come together in their highly elliptical orbit.
Because of the dense cloud of dust, nobody is quite sure what is going on inside this nebula but everyone agrees that it must be a hugely complex process. To find out more, Madura and pals have used data on Eta Carinae from orbiting observatories such as the Swift x-ray telescope and used it to simulate what must be going on inside this cloud on a supercomputer.
The results are hugely impressive. They show the way these winds interact as the stars orbit one another and in particular, how the resultant shockwave changes throughout the orbit. This is a complex phenomenon that is hard to represent visually, a classic problem faced by scientists in many different disciplines. So Madura and co have experimented with some new ways to represent the data.
One common approach for showing 3-D models in a conventional scientific paper is to carve the model into two-dimensional slices and then display these on the page in an array. The idea is that readers can piece together the slices to produce a 3-D model in their minds’ eye.
That is easier said than done, particularly when the model is changing over time. In this case, the paper can end up being filled with a large number of slices that are hard for readers to process.
Madura and co take a different approach. To begin with, they take advantage of an increasingly popular feature of Adobe Reader, the standard software for displaying PDFs. This allows authors to embed 3-D interactive figures in their paper (view the paper with Adobe Reader to try this).
Madura and co do just this. They create 3-D models of the shockwave inside Eta Carina at different points around the orbit, slice up the models and display them in the conventional way. But they also include a 3-D interactive figure that allows a viewer to see and interact with the 3-D model.
The team is gone even further. Having created a virtual 3-D model, they print it using a standard 3-D printer, a MakerBot Replicator 2X.
They say this provides even more insight into what’s going on. “The ability to hold and inspect the 3-D printed models provides a new perspective on the WWIR’s geometry and an improved sense of the scale of the different structures,” they say. In particular, they say the model allows them to appreciate just how large the shockwave is compared to the stars and the distance between them.
The 3-D models also give a clearer sense of the line-of-sight view that astronomers get from Earth. The shockwaves inside the nebula, and the structures they create, can absorb radiation and prevent it reaching Earth. Having a clear line of sight shows just how sensitive this is to astronomers’ point of view. There are other benefits as well such as making the data accessible to people who are visually impaired.
3-D printed models also have some drawbacks. Madura and co say that one of the delicate features on their model accidentally broke off while they were handling it, a problem they fixed by simply gluing it back on.
The results provide an unprecedented new insight into the nature of the nebula and the shockwave within it. The simulations and the 3-D prints show that as the stars reach their point of closest approach, the shockwave forms into finger-like structures that protrude from the center of the nebula. These are tubes of cool gas surrounded by much hotter post-shock gas.
The tubes then dissipate as the stars move further apart. This complex structure explains why this star system produces such variable output. Parts of the shockwave itself produces x-rays and other wavelengths but these can be absorbed by other regions of the shockwave. What we observed from Earth depends on the alignment of the structures, which varies in time and in unpredictable ways because of the nature of the turbulence involved.
That is a fascinating insight into one of the more fascinating astrophysical objects in the night sky. NASA has also produced a video about this work.
It also explores new ways of representing and studying complex data sets, something that has only become possible in recent years because of the move to electronic publishing. “The success of our work and easy identification of previously unrecognized physical features highlight the important role 3-D printing and interactive graphics can play in the visualization and understanding of complex 3-D time-dependent numerical simulations of astrophysical phenomena,” they say.
Expect to see more experimentation with data sets as people push the boundaries of scientific publishing.
Ref: http://arxiv.org/abs/1503.00716 : 3-D Printing Meets Computational Astrophysics: Deciphering the Structure of Eta Carinae’s Inner Colliding Winds
Keep Reading
Most Popular
Large language models can do jaw-dropping things. But nobody knows exactly why.
And that's a problem. Figuring it out is one of the biggest scientific puzzles of our time and a crucial step towards controlling more powerful future models.
The problem with plug-in hybrids? Their drivers.
Plug-in hybrids are often sold as a transition to EVs, but new data from Europe shows we’re still underestimating the emissions they produce.
Google DeepMind’s new generative model makes Super Mario–like games from scratch
Genie learns how to control games by watching hours and hours of video. It could help train next-gen robots too.
How scientists traced a mysterious covid case back to six toilets
When wastewater surveillance turns into a hunt for a single infected individual, the ethics get tricky.
Stay connected
Get the latest updates from
MIT Technology Review
Discover special offers, top stories, upcoming events, and more.