Obama’s Data Techniques Will Rule Future Elections

In the summer of 2011, Carol Davidsen received a message from Dan Wagner. Already the Obama campaign was known for its relentless e-mails beseeching supporters to give their money or time, but this one offered something that intrigued Davidsen: a job. Wagner had sorted the campaign’s list of donors, stretching back to 2008, to find those who described their occupation with terms like “data” and “analytics” and sent them all invitations to apply for work in his new analytics department.
Davidsen was working at Navic Networks, a Microsoft-owned company that wrote code for set-top cable boxes to create a record of a user’s DVR or tuner history, when she heeded Wagner’s call. One year before Election Day, she started work in the campaign’s technology department to serve as product manager for Narwhal. That was the code name, borrowed from a tusked whale, for an ambitious effort to match records from previously unconnected databases so that a user’s online interactions with the campaign could be synchronized. With Narwhal, e-mail blasts asking people to volunteer could take their past donation history into consideration, and the algorithms determining how much a supporter would be asked to contribute could be shaped by knowledge about his or her reaction to previous solicitations. This integration enriched a technique, common in website development, that Obama’s online fund-raising efforts had used to good effect in 2008: the A/B test, in which users are randomly directed to different versions of a thing and their responses are compared. Now analysts could leverage personal data to identify the attributes of those who responded, and use that knowledge to refine subsequent appeals. “You can cite people’s other types of engagement,” says Amelia Showalter, Obama’s director of digital analytics. “We discovered that there were a lot of things that built goodwill, like signing the president’s birthday card or getting a free bumper sticker, that led them to become more engaged with the campaign in other ways.”
If online communication had been the aspect of the 2008 campaign subjected to the most rigorous empirical examination—it’s easy to randomly assign e-mails in an A/B test and compare click-through rates or donation levels—mass-media strategy was among those that received the least. Television and radio ads had to be purchased by geographic zone, and the available data on who watches which channels or shows, collected by research firms like Nielsen and Scarborough, often included little more than viewer age and gender. That might be good enough to guide buys for Schick or Foot Locker, but it’s of limited value for advertisers looking to define audiences in political terms.
As campaign manager Jim Messina prepared to spend as much as half a billion dollars on mass media for Obama’s reëlection, he set out to reinvent the process for allocating resources across broadcast, cable, satellite, and online channels. “If you think about the universe of possible places for an advertiser, it’s almost infinite,” says Amy Gershkoff, who was hired as the campaign’s media-planning director on the strength of her successful negotiations, while at her firm Changing Targets in 2009, to link the information from cable systems to individual microtargeting profiles. “There are tens of millions of opportunities where a campaign can put its next dollar. You have all this great, robust voter data that doesn’t fit together with the media data. How you knit that together is a challenge.”
By the start of 2012, Wagner had deftly wrested command of media planning into his own department. As he expanded the scope of analytics, he defined his purview as “the study and practice of resource optimization for the purpose of improving programs and earning votes more efficiently.” That usually meant calculating, for any campaign activity, the number of votes gained through a given amount of contact at a given cost.
But when it came to buying media, such calculations had been simply impossible, because campaigns were unable to link what they knew about voters to what cable providers knew about their customers. Obama’s advisors decided that the data made available in the private sector had long led political advertisers to ask the wrong questions. Walsh says of the effort to reimagine the media-targeting process: “It was not to get a better understanding of what 35-plus women watch on TV. It was to find out how many of our persuadable voters were watching those dayparts.”
Davidsen, whose previous work had left her intimately familiar with the rich data sets held in set-top boxes, understood that a lot of that data was available in the form of tuner and DVR histories collected by cable providers and then aggregated by research firms. For privacy reasons, however, the information was not available at the individual level. “The hardest thing in media buying right now is the lack of information,” she says.
Davidsen began negotiating to have research firms repackage their data in a form that would permit the campaign to access the individual histories without violating the cable providers’ privacy standards. Under a $350,000 deal she worked out with one company, Rentrak, the campaign provided a list of persuadable voters and their addresses, derived from its microtargeting models, and the company looked for them in the cable providers’ billing files. When a record matched, Rentrak would issue it a unique household ID that identified viewing data from a single set-top box but masked any personally identifiable information.
The Obama campaign had created its own television ratings system, a kind of Nielsen in which the only viewers who mattered were those not yet fully committed to a presidential candidate. But Davidsen had to get the information into a practical form by early May, when Obama strategists planned to start running their anti-Romney ads. She oversaw the development of a software platform the Obama staff called the Optimizer, which broke the day into 96 quarter-hour segments and assessed which time slots across 60 channels offered the greatest number of persuadable targets per dollar. (By September, she had unlocked an even richer trove of data: a cable system in Toledo, Ohio, that tracked viewers’ tuner histories by the second.) “The revolution of media buying in this campaign,” says Terry Walsh, who coördinated the campaign’s polling and advertising spending, “was to turn what was a broadcast medium into something that looks a lot more like a narrowcast medium.”
When the Obama campaign did use television as a mass medium, it was because the Optimizer had concluded it would be a more efficient way of reaching persuadable targets. Sometimes a national cable ad was a better bargain than a large number of local buys in the 66 media markets reaching battleground states. But the occasional national buy also had other benefits. It could boost fund-raising and motivate volunteers in states that weren’t essential to Obama’s Electoral College arithmetic. And, says Davidsen, “it helps hide some of the strategy of your buying.”
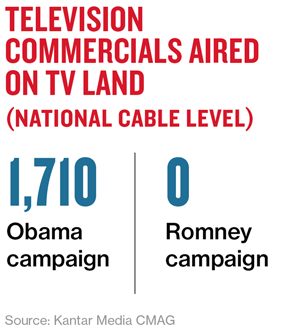
Even without that tactic, Obama’s buys perplexed the Romney analysts in Boston. They had invested in their own media-intelligence platform, called Centraforce. It used some of the same aggregated data sources that were feeding into the Optimizer, and at times both seemed to send the campaigns to the same unlikely ad blocks—for example, in reruns on TV Land. But there was a lot more to what Alex Lundry, who created Romney’s data science unit, called Obama’s “highly variable” media strategy. Many of the Democrats’ ads were placed in fringe markets, on marginal stations, and at odd times where few political candidates had ever seen value. Romney’s data scientists simply could not decode those decisions without the voter models or persuasion experiments that helped Obama pick out individual targets. “We were never able to figure out the level of advertising and what they were trying to do,” says Romney data analyst Brent McGoldrick. “It wasn’t worth reverse-engineering, because what are you going to do?”
The Community
Although the voter opinion tables that emerged from the Cave looked a lot like polls, the analysts who produced them were disinclined to call them polls. The campaign had plenty of those, generated by a public-opinion team of eight outside firms, and new arrivals at the Chicago headquarters were shocked by the variegated breadth of the research that arrived on their desks daily. “We believed in combining the qual, which we did more than any campaign ever, with the quant, which we [also] did more than any other campaign, to make sure all communication for every level of the campaign was informed by what they found,” says David Simas, the director of opinion research.
Simas considered himself the “air-traffic controller” for such research, which was guided by a series of voter diaries that Obama’s team commissioned as it prepared for the reëlection campaign. “We needed to do something almost divorced from politics and get to the way they’re seeing their lives,” he says. The lead pollster, Joel Benenson, had respondents write about their experiences. The entries frequently used the word “disappointment,” which helped explain attitudes toward Obama’s administration but also spoke to a broader dissatisfaction with economic conditions. “That became the foundation for our entire research program,” says Simas.

Obama’s advisors used those diaries to develop messages that contrasted Obama with Romney as a fighter for the middle class. Benenson’s national polls tested language to see which affected voters’ responses in survey experiments and direct questioning. A quartet of polling firms were assigned specific states and asked to figure out which national themes fit best with local concerns. Eventually, Obama’s media advisors created more than 500 ads and tested them before an online sample of viewers selected by focus-group director David Binder.
But the campaign had to play defense, too. When something potentially damaging popped up in the news, like Democratic consultant Hilary Rosen’s declaration that Ann Romney had “never worked a day in her life,” Simas checked in with the Community, a private online bulletin board populated by 100 undecided voters Binder had recruited. Simas would monitor Community conversations to see which news events penetrated voter consciousness. Sometimes he had Binder show its members controversial material—like a video clip of Obama’s “You didn’t build that” comment—and ask if it changed their views of the candidate. “For me, it was a very quick way to draw back and determine whether something was a problem or not a problem,” says Simas.
When Wagner started packaging his department’s research into something that campaign leadership could read like a poll, a pattern became apparent. Obama’s numbers in key battleground states were low in the analytic tables, but Romney’s were too. There were simply more undecided voters in such states—sometimes nearly twice as many as the traditional pollsters found. A basic methodological distinction explained this discrepancy: microtargeting models required interviewing a lot of unlikely voters to give shape to a profile of what a nonvoter looked like, while pollsters tracking the horse race wanted to screen more rigorously for those likely to cast a ballot. The rivalry between the two units trying to measure public opinion grew intense: the analytic polls were a threat to the pollsters’ primacy and, potentially, to their business model. “I spent a lot of time within the campaign explaining to people that the numbers we get from analytics and the numbers we get from external pollsters did not need strictly to be reconciled,” says Walsh. “They were different.”
The scope of the analytic research enabled it to pick up movements too small for traditional polls to perceive. As Simas reviewed Wagner’s analytic tables in mid-October, he was alarmed to see that what had been a Romney lead of one to two points in Green Bay, Wisconsin, had grown into an advantage of between six and nine. Green Bay was the only media market in the state to experience such a shift, and there was no obvious explanation. But it was hard to discount. Whereas a standard 800-person statewide poll might have reached 100 respondents in the Green Bay area, analytics was placing 5,000 calls in Wisconsin in each five-day cycle—and benefiting from tens of thousands of other field contacts—to produce microtargeting scores. Analytics was talking to as many people in the Green Bay media market as traditional pollsters were talking to across Wisconsin every week. “We could have the confidence level to say, ‘This isn’t noise,’” says Simas. So the campaign’s media buyers aired an ad attacking Romney on outsourcing and beseeched Messina to send former president Bill Clinton and Obama himself to rallies there. (In the end, Romney took the county 50.3 to 48.5 percent.)
For the most part, however, the analytic tables demonstrated how stable the electorate was, and how predictable individual voters could be. Polls from the media and academic institutions may have fluctuated by the hour, but drawing on hundreds of data points to judge whether someone was a likely voter proved more reliable than using a seven-question battery like Gallup’s to do the same. “When you see this Pogo stick happening with the public data—the electorate is just not that volatile,” says Mitch Stewart, director of the Democratic campaign group Organizing for America. The analytic data offered a source of calm.
Romney’s advisors were similarly sanguine, but they were losing. They, too, believed it possible to project the composition of the electorate, relying on a method similar to Gallup’s: pollster Neil Newhouse asked respondents how likely they were to cast a ballot. Those who answered that question with a seven or below on a 10-point scale were disregarded as not inclined to vote. But that ignored the experimental methods that made it possible to measure individual behavior and the impact that a campaign itself could have on a citizen’s motivation. As a result, the Republicans failed to account for voters that the Obama campaign could be mobilizing even if they looked to Election Day without enthusiasm or intensity.
On the last day of the race, Wagner and his analytics staff left the Cave and rode the elevator up one floor in the campaign’s Chicago skyscraper to join members of other departments in a boiler room established to help track votes as they came in. Already, for over a month, Obama’s analysts had been counting ballots from states that allowed citizens to vote early. Each day, the campaign overlaid the lists of early voters released by election authorities with its modeling scores to project how many votes they could claim as their own.
By Election Day, Wagner’s analytic tables turned into predictions. Before the polls opened in Ohio, authorities in Hamilton County, the state’s third-largest and home to Cincinnati, released the names of 103,508 voters who had cast early ballots over the previous month. Wagner sorted them by microtargeting projections and found that 58,379 had individual support scores over 50.1—that is, the campaign’s models predicted that they were more likely than not to have voted for Obama. That amounted to 56.4 percent of the county’s votes, or a raw lead of 13,249 votes over Romney. Early ballots were the first to be counted after Ohio’s polls closed, and Obama’s senior staff gathered around screens in the boiler room to see the initial tally. The numbers settled almost exactly where Wagner had said they would: Obama got 56.6 percent of the votes in Hamilton County. In Florida, he was as close to the mark; Obama’s margin was only two-tenths of a percent off. “After those first two numbers, we knew,” says Bird. “It was dead-on.”
When Obama was reëlected, and by a far larger Electoral College margin than most outsiders had anticipated, his staff was exhilarated but not surprised. The next morning, Mitch Stewart sat in the boiler room, alone, monitoring the lagging votes as they came into Obama’s servers from election authorities in Florida, the last state to name a winner. The presidency was no longer at stake; the only thing that still hung in the balance was the accuracy of the analytics department’s predictions.
The Legacy
A few days after the election, as Florida authorities continued to count provisional ballots, a few staff members were directed, as four years before, to remain in Chicago. Their instructions were to produce another post-mortem report summing up the lessons of the past year and a half. The undertaking was called the Legacy Project, a grandiose title inspired by the idea that the innovations of Obama 2012 should be translated not only to the campaign of the next Democratic candidate for president but also to governance. Obama had succeeded in convincing some citizens that a modest adjustment to their behavior would affect, however marginally, the result of an election. Could he make them feel the same way about Congress?
Simas, who had served in the White House before joining the team, marveled at the intimacy of the campaign. Perhaps more than anyone else at headquarters, he appreciated the human aspect of politics. This had been his first presidential election, but before he became a political operative, Simas had been a politician himself, serving on the city council and school board in his hometown of Taunton, Massachusetts. He ran for office by knocking on doors and interacting individually with constituents (or those he hoped would become constituents), trying to track their moods and expectations.
In many respects, analytics had made it possible for the Obama campaign to recapture that style of politics. Though the old guard may have viewed such techniques as a disruptive force in campaigns, they enabled a presidential candidate to view the electorate the way local candidates do: as a collection of people who make up a more perfect union, each of them approachable on his or her terms, their changing levels of support and enthusiasm open to measurement and, thus, to respect. “What that gave us was the ability to run a national presidential campaign the way you’d do a local ward campaign,” Simas says. “You know the people on your block. People have relationships with one another, and you leverage them so you know the way they talk about issues, what they’re discussing at the coffee shop.”
Few events in American life other than a presidential election touch 126 million adults, or even a significant fraction that many, on a single day. Certainly no corporation, no civic institution, and very few government agencies ever do. Obama did so by reducing every American to a series of numbers. Yet those numbers somehow captured the individuality of each voter, and they were not demographic classifications. The scores measured the ability of people to change politics—and to be changed by it.
This story was updated on December 18 to correct the description of Neil Newhouse’s poll for the Republicans.
Keep Reading
Most Popular
Large language models can do jaw-dropping things. But nobody knows exactly why.
And that's a problem. Figuring it out is one of the biggest scientific puzzles of our time and a crucial step towards controlling more powerful future models.
How scientists traced a mysterious covid case back to six toilets
When wastewater surveillance turns into a hunt for a single infected individual, the ethics get tricky.
The problem with plug-in hybrids? Their drivers.
Plug-in hybrids are often sold as a transition to EVs, but new data from Europe shows we’re still underestimating the emissions they produce.
Stay connected
Get the latest updates from
MIT Technology Review
Discover special offers, top stories, upcoming events, and more.