How Japan’s Earthquake and Tsunami Warning Systems Work
The earthquake that struck Japan early this morning was the worst seen in that country for over 300 years (with a local magnitude of 8.9). Hundreds have been killed and injured so far, but the loss of life was likely limited by two vital early warning technologies: a new earthquake alert system, and ocean-based tsunami warning system.
The earthquake warning system, which has never been triggered before, automatically issued alerts via television and cell phones shortly after the first, less harmful, shock wave was detected, providing time for many people to prepare for the more powerful shock wave that followed. It also caused many energy and industrial facilities, and transportation services to shut down automatically. A string of detection buoys in the Pacific Ocean detected the tsunami that resulted from the earthquake, sending warnings of possible catastrophe to many different nations.
Here are some good resources that will help you learn more about both warning systems.

The graphic above shows the stages involved with triggered Japan’s earthquake warning system. Further information can be found at this page of the Japan Meteorological Agency.
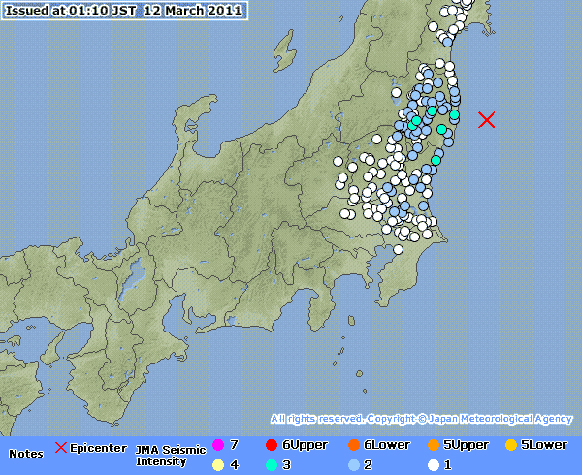
This image shows the location of detected seismic activity, and its severity (Japan uses a different scale for measuring the intensity of earthquakes). Further information here.

The graphic above shows how the Deep-ocean Assessment and Reporting of Tsunami (DART) tsunami buoys work.

The image above shows the location of tsunami buoys across the Pacific, and which buoys have been triggered (the larger yellow diamonds). Live information can be found in this page at the National Oceanic and Atmospheric Administrations National Data Buoy Center.
Updated 14:30 EST: NOAA has published a page dedicated to the tsunami event.

The image above was generated using the method of splitting tsunami (MOST) model. It uses data collected by tsunami buoys to estimate the wave arrival time and the wave height of the tsunami.
Deep Dive
Computing
How ASML took over the chipmaking chessboard
MIT Technology Review sat down with outgoing CTO Martin van den Brink to talk about the company’s rise to dominance and the life and death of Moore’s Law.
How Wi-Fi sensing became usable tech
After a decade of obscurity, the technology is being used to track people’s movements.
Why it’s so hard for China’s chip industry to become self-sufficient
Chip companies from the US and China are developing new materials to reduce reliance on a Japanese monopoly. It won’t be easy.
Stay connected
Get the latest updates from
MIT Technology Review
Discover special offers, top stories, upcoming events, and more.