Political scientists have long studied the news cycle, tracking which people and topics drive coverage and for how long. But the sheer volume of news outlets made it hard to quantify their results.
Researchers at Cornell University are trying to get a quantitative handle on how news stories proliferate. Computer scientist Jon Kleinberg reasoned that instead of trying to sort items from blogs and news sites into arbitrary categories, he could home in on quotes to identify their topics computationally. But references to a quote might extract different phrases from it, change its tense, or paraphrase it, resulting in dozens of different versions. So Kleinberg and his colleagues developed algorithms that determine family resemblances between strings of words in different articles.
The researchers are now canvassing about a million online news items a day. Focusing on quotes might exclude some relevant items, but it helps identify the types of stories that prove most popular and the websites that report on them first. The researchers have found that with the exception of a handful of professional political blogs that are the fastest to sniff out a story, mainstream media sites drive coverage, converging on a story two and a half hours before blogs react. But mainstream sites are also quick to abandon stories, while blog interest can persist for days.
Multimedia
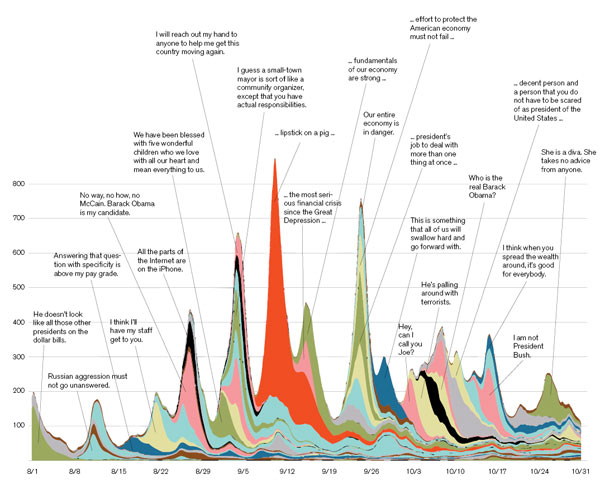
A chart (also below, here as a pdf) of online buzz words.
Pop chart: This graph depicts the 50 phrases that generated the most buzz online in the last three months of the 2008 presidential campaign. The vertical axis indicates the number of Web items featuring some version of the phrase posted hourly; the horizontal axis shows fluctuation over time. Each phrase has an associated color, some labeled with phrase excerpts.
Credit: Jure Leskovec, Lars Backstrom, and Jon Kleinberg
Keep Reading
Most Popular
Large language models can do jaw-dropping things. But nobody knows exactly why.
And that's a problem. Figuring it out is one of the biggest scientific puzzles of our time and a crucial step towards controlling more powerful future models.
The problem with plug-in hybrids? Their drivers.
Plug-in hybrids are often sold as a transition to EVs, but new data from Europe shows we’re still underestimating the emissions they produce.
Google DeepMind’s new generative model makes Super Mario–like games from scratch
Genie learns how to control games by watching hours and hours of video. It could help train next-gen robots too.
How scientists traced a mysterious covid case back to six toilets
When wastewater surveillance turns into a hunt for a single infected individual, the ethics get tricky.
Stay connected
Get the latest updates from
MIT Technology Review
Discover special offers, top stories, upcoming events, and more.