Mathematicians are deploying algorithms to stop gerrymandering
With the 2020 US Census data release, states start the process of redrawing district maps. New computational tools will help hold politicians to account.
The maps for US congressional and state legislative races often resemble electoral bestiaries, with bizarrely shaped districts emerging from wonky hybrids of counties, precincts, and census blocks.
It’s the drawing of these maps, more than anything—more than voter suppression laws, more than voter fraud—that determines how votes translate into who gets elected. “You can take the same set of votes, with different district maps, and get very different outcomes,” says Jonathan Mattingly, a mathematician at Duke University in the purple state of North Carolina. “The question is, if the choice of maps is so important to how we interpret these votes, which map should we choose, and how should we decide if someone has done a good job in choosing that map?”
Over recent months, Mattingly and like-minded mathematicians have been busy in anticipation of a data release expected today, August 12, from the US Census Bureau. Every decade, new census data launches the decennial redistricting cycle—state legislators (or sometimes appointed commissions) draw new maps, moving district lines to account for demographic shifts.
In preparation, mathematicians are sharpening new algorithms—open-source tools, developed over recent years—that detect and counter gerrymandering, the egregious practice giving rise to those bestiaries, whereby politicians rig the maps and skew the results to favor one political party over another. Republicans have openly declared that with this redistricting cycle they intend to gerrymander a path to retaking the US House of Representatives in 2022.
"The situation has changed in the last decade, as computer technology has caught up with the problem that it spawned."
ERIC LANDER
“This is crunch time,” says Moon Duchin via email. A mathematician at Tufts University, Duchin leads the Metric Geometry and Gerrymandering Group, and she is a coauthor of a recent paper about a new tool called GerryChain (first developed in 2018), which has been downloaded 20,000 times.
Kosuke Imai, a Harvard political scientist, and his research group—focused on what they call the Algorithm-Assisted Redistricting Methodology (ALARM)—are refining a software package called “redist,” making it as user-friendly as possible for even the citizen data scientist. “This summer I have two high school students using it doing analysis,” Imai says. One is looking at how redistricting might play out in Alabama.
Tools like these will play a critical role in the looming political battles. Computational mathematics and quantitative analysis are poised to have a major impact on redistricting, providing an objective and practical standard—an algorithmic test—for identifying gerrymandered maps. Ideally they’ll be used throughout the entire process, in public forums and consultations with legislators that might influence which maps get passed into law; but also, perhaps more realistically and crucially, they will come into play after the fact, in the expected lawsuits. “This will be the first time that we have a different level of technical prowess to talk about what’s going on,” says Mattingly.
Lizard politics
The term “gerrymander” dates to 1812, when a Massachusetts district drawn to the advantage of Governor Elbridge Gerry was so strangely shaped that it was likened to a salamander. Thus, to “gerrymander” is to manipulate district boundaries with a political agenda, and thereby manipulate election outcomes.
The use of computers to generate and gerrymander electoral maps became relatively common in the 1990s, although early redistricting software was prohibitively expensive, costing $500,000 to $1 million. Now the industry standard is Maptitude, made by Caliper. When the first Maptitude for Redistricting package was released, in the late 1990s, it cost $2,999. The current price ranges from $1,000 to $10,000, depending on the user’s needs.
For decades, one of those users was Thomas Hofeller, “the Michelangelo of the modern gerrymander,” long the Republican National Committee’s official redistricting director, who died in 2018.
Gerrymandering schemes include “cracking” and “packing”—scattering votes for one party across districts, thus diluting their power, and stuffing like-minded voters into a single district, wasting the power they would have elsewhere. The city of Austin, Texas, is cracked, split among six districts (it is the largest US city that does not anchor a district).
In 2010, the full force of the threat materialized with the Republicans’ Redistricting Majority Project, or REDMAP. It spent $30 million on down-ballot state legislative races, with winning results in Florida, North Carolina, Wisconsin, Michigan, and Ohio. “The wins in 2010 gave them the power to draw the maps in 2011,” says David Daley, author of, Ratf**ked: The True Story Behind the Secret Plan to Steal America's Democracy.
"What used to be a dark art is now a dark science."
MICHAEL LI
That the technology had advanced by leaps and bounds since the previous redistricting cycle only supercharged the outcome. “It made the gerrymanders drawn that year so much more lasting and enduring than any other gerrymanders in our nation’s history,” he says. “It’s the sophistication of the computer software, the speed of the computers, the amount of data available, that makes it possible for partisan mapmakers to put their maps through 60 or 70 different iterations and to really refine and optimize the partisan performance of those maps.”
As Michael Li, a redistricting expert at the Brennan Center for Justice at the New York University’s law school, puts it: “What used to be a dark art is now a dark science.” And when manipulated maps are implemented in an election, he says, they are nearly impossible to overcome.
A mathematical microscope
Mattingly and his Duke team have been staying up late writing code that they expect will produce a “huge win, algorithmically”—preparing for real-life application of their latest tool, which debuted in a paper (currently under review) with the technically heady title “Multi-Scale Merge-Split Markov Chain Monte Carlo for Redistricting.”
Advancing the technical discourse, however, is not the top priority. Mattingly and his colleagues hope to educate the politicians and the public alike, as well as lawyers, judges, fellow mathematicians, scientists—anyone interested in the cause of democracy. In July, Mattingly gave a public lecture with a more accessible title that cut to the quick: “Can you hear the will of the people in the vote?”
Misshapen districts are often thought to be the mark of a gerrymander. With the 2012 map in North Carolina, the congressional districts were “very strange-looking beasts,” says Mattingly, who (with his key collaborator, Greg Herschlag) provided expert testimony in some of the ensuing lawsuits. Over the last decade, there have been legal challenges across the country—in Illinois, Maryland, Ohio, Pennsylvania, Wisconsin.
But while such disfigured districts “make really nice posters and coffee cups and T-shirts, ” Mattingly says, “ the truth is that stopping strange geometries will not stop gerrymandering.” And in fact, with all the technologically sophisticated sleights of hand, a gerrymandered map can prove tricky to detect.
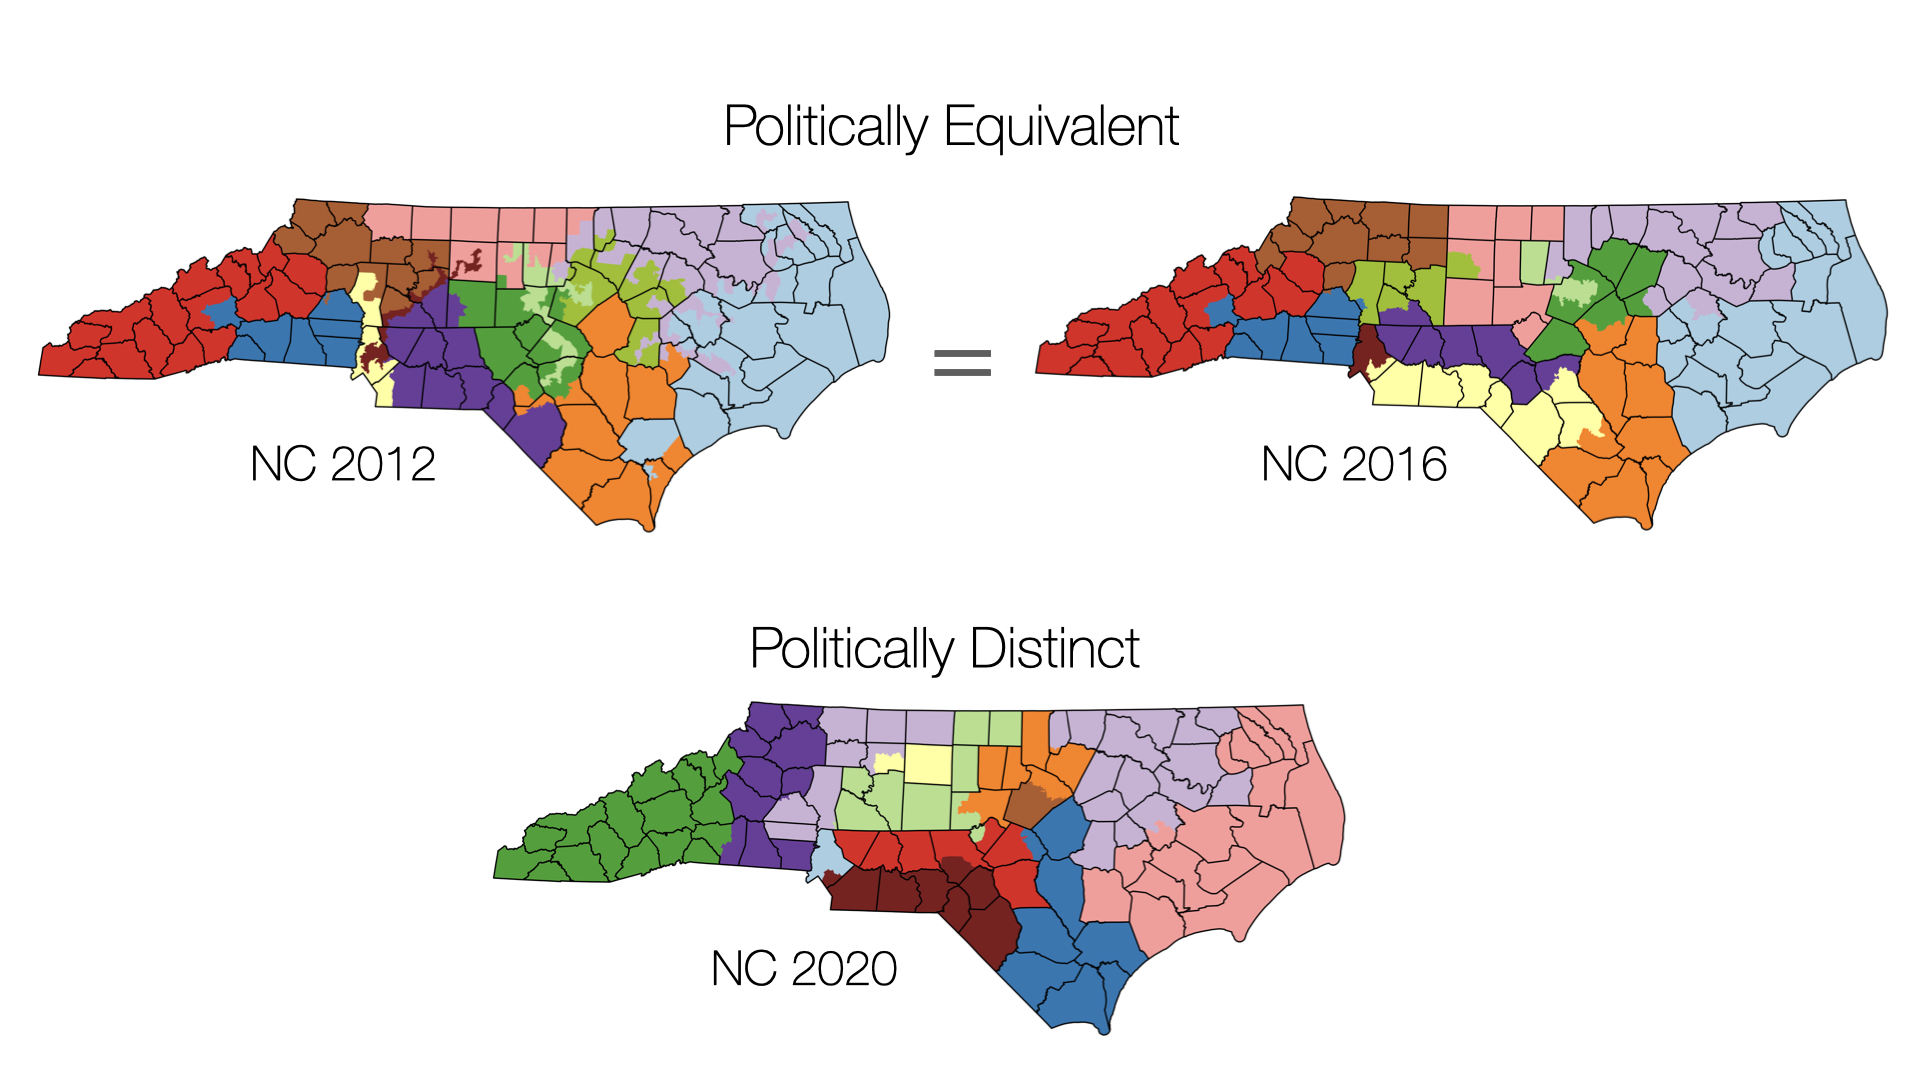
The tools developed simultaneously by a number of mathematical scientists provide what’s called an “extreme-outlier test.” Each researcher’s approach is slightly different, but the upshot is as follows: a map suspected of being gerrymandered is compared with a large collection, or “ensemble,” of unbiased, neutral maps. The mathematical method at work—based on what are called Markov chain Monte Carlo algorithms—generates a random sample of maps from a universe of possible maps, and reflects the likelihood that any given map drawn will satisfy various policy considerations.
The ensemble maps are encoded to capture various principles used to draw districts, factoring in the way these principles interact with a state’s geopolitical geometry. The principles (which vary from state to state) include such criteria as keeping districts relatively compact and connected, making them roughly equal in population, and preserving counties, municipalities, and communities with common interests. And district maps must comply with the US Constitution and the Voting Rights Act of 1965.
With the Census Bureau’s release of the 2020 data, Mattingly and his team will load up the data set, run their algorithm, and generate a collection of typical, nonpartisan district plans for North Carolina. From this vast distribution of maps, and factoring in historical voting patterns, they’ll discern benchmarks that should serve as guardrails. For instance, they’ll assess the relative likelihood that those maps would produce various election outcome —say, the number of seats won by Democrats and Republicans—and by what margin: with a 50-50 split in the vote, and given plausible voting patterns, it’s unlikely that a neutral map would give Republicans 10 seats and the Democrats only three (as was the case with that 2012 map).
“We’re using computational mathematics to figure out what we’d expect as outcomes for unbiased maps, and then we can compare with a particular map,” says Mattingly.
By mid-September they’ll announce their findings and hope state legislators heed the guardrails. Once new district maps are proposed later in the fall, they’ll analyze the results and engage with the public and political conversations that ensue—and if the maps are again suspected to be gerrymandered, there will be more lawsuits, in which mathematicians will again play a central role.
“I don’t want to just convince someone that something is wrong,” Mattingly says. “I want to give them a microscope so they can look at a map and understand its properties and then draw their own conclusions.”

When Mattingly testified in 2017 and 2019, analyzing two subsequent iterations of North Carolina’s district maps, the court agreed that the maps in question were excessively partisan gerrymanders, discriminating against Democrats. Wes Pegden, a mathematician at Carnegie Mellon University, testified using a similar method in a Pennsylvania case; the court agreed that the map in question discriminated against Republicans.
“Courts have long struggled with how to measure partisan gerrymandering,” says Li. “But then there seemed to be a breakthrough, when court after court struck down maps using some of these new tools.”
When the North Carolina case reached the US Supreme Court in 2019 (together with a Maryland case), the mathematician and geneticist Eric Lander, a professor at Harvard and MIT who is now President Biden’s top science advisor, observed in a brief that “computer technology has caught up with the problem that it spawned.” He deemed the extreme-outlier standard—a test that simply asks, “What fraction of redistricting plans are less extreme than the proposed plan?”—a “straightforward, quantitative mathematical question to which there is a right answer.”
The majority of the justices concluded otherwise.
“The five justices on the Supreme Court are the only ones who seemed to have trouble seeing how the math and models worked,” says Li. “State and other federal courts managed to apply it—this was not beyond the intellectual ability of the courts to handle, any more than a complex sex discrimination case is, or a complex securities fraud case. But five justices of the Supreme Court said, ‘This is too hard for us.’”
“They also said, ‘This is not for us to fix—this is for the states to fix; this is for Congress to fix; it’s not for us to fix,’” says Li.
Will it matter?
As Daley sees it, the Supreme Court decision gives state lawmakers “a green light and no speed limit when it comes to the kind of partisan gerrymanders that they can enact when map-making later this month.” At the same time, he says, “the technology has improved to such a place that we can now use [it] to see through the technology-driven gerrymanders that are created by lawmakers.”
Recent changes in the Maptitude for Redistricting software also aim to guard against gerrymandering. The latest version, released to users at the end of July, includes the ensemble method, as well metrics that measure “fracking” (the fractionalization of geographic units such as counties) and travel contiguity (travel should be possible from any one place to any other place in a district without leaving the district). And there is a new product called Maptitude Online Redistricting that allows the public to see and evaluate plans and propose their own.
“In the past it’s been very hard for people to react,” says Li. But now people can take a map and plug it into a computer: in a matter of minutes, using all sorts of metrics, the computer spits out an assessment of whether the map is good or bad.
Democratizing the technology, putting the computational tools in the hands of citizens, might offer the greatest opportunity to counter the threat of gerrymandering.
“The question that we have to answer is, how much will that matter?” says Daley. “In the real world of politics, how much will that matter? And I think the answer is, it’s complicated.”
Deep Dive
Computing
Inside the hunt for new physics at the world’s largest particle collider
The Large Hadron Collider hasn’t seen any new particles since the discovery of the Higgs boson in 2012. Here’s what researchers are trying to do about it.
How ASML took over the chipmaking chessboard
MIT Technology Review sat down with outgoing CTO Martin van den Brink to talk about the company’s rise to dominance and the life and death of Moore’s Law.
How Wi-Fi sensing became usable tech
After a decade of obscurity, the technology is being used to track people’s movements.
Algorithms are everywhere
Three new books warn against turning into the person the algorithm thinks you are.
Stay connected
Get the latest updates from
MIT Technology Review
Discover special offers, top stories, upcoming events, and more.