The chart that shows how we’ll get back to normal

A covid-19 chart that’s been shared thousands of times is dramatizing just how well vaccines against the disease can work and how we might get out of pandemic hell.
Today, advisors to the US Food and Drug Administration voted in favor of emergency authorization for Pfizer’s covid-19 shot, and the data in this chart is a big reason why.
The graphic (below), released by Pfizer and its partner, BioNTech, shows the difference in covid-19 infection rates between the people in their trial who got a novel gene vaccine and those who got a placebo.
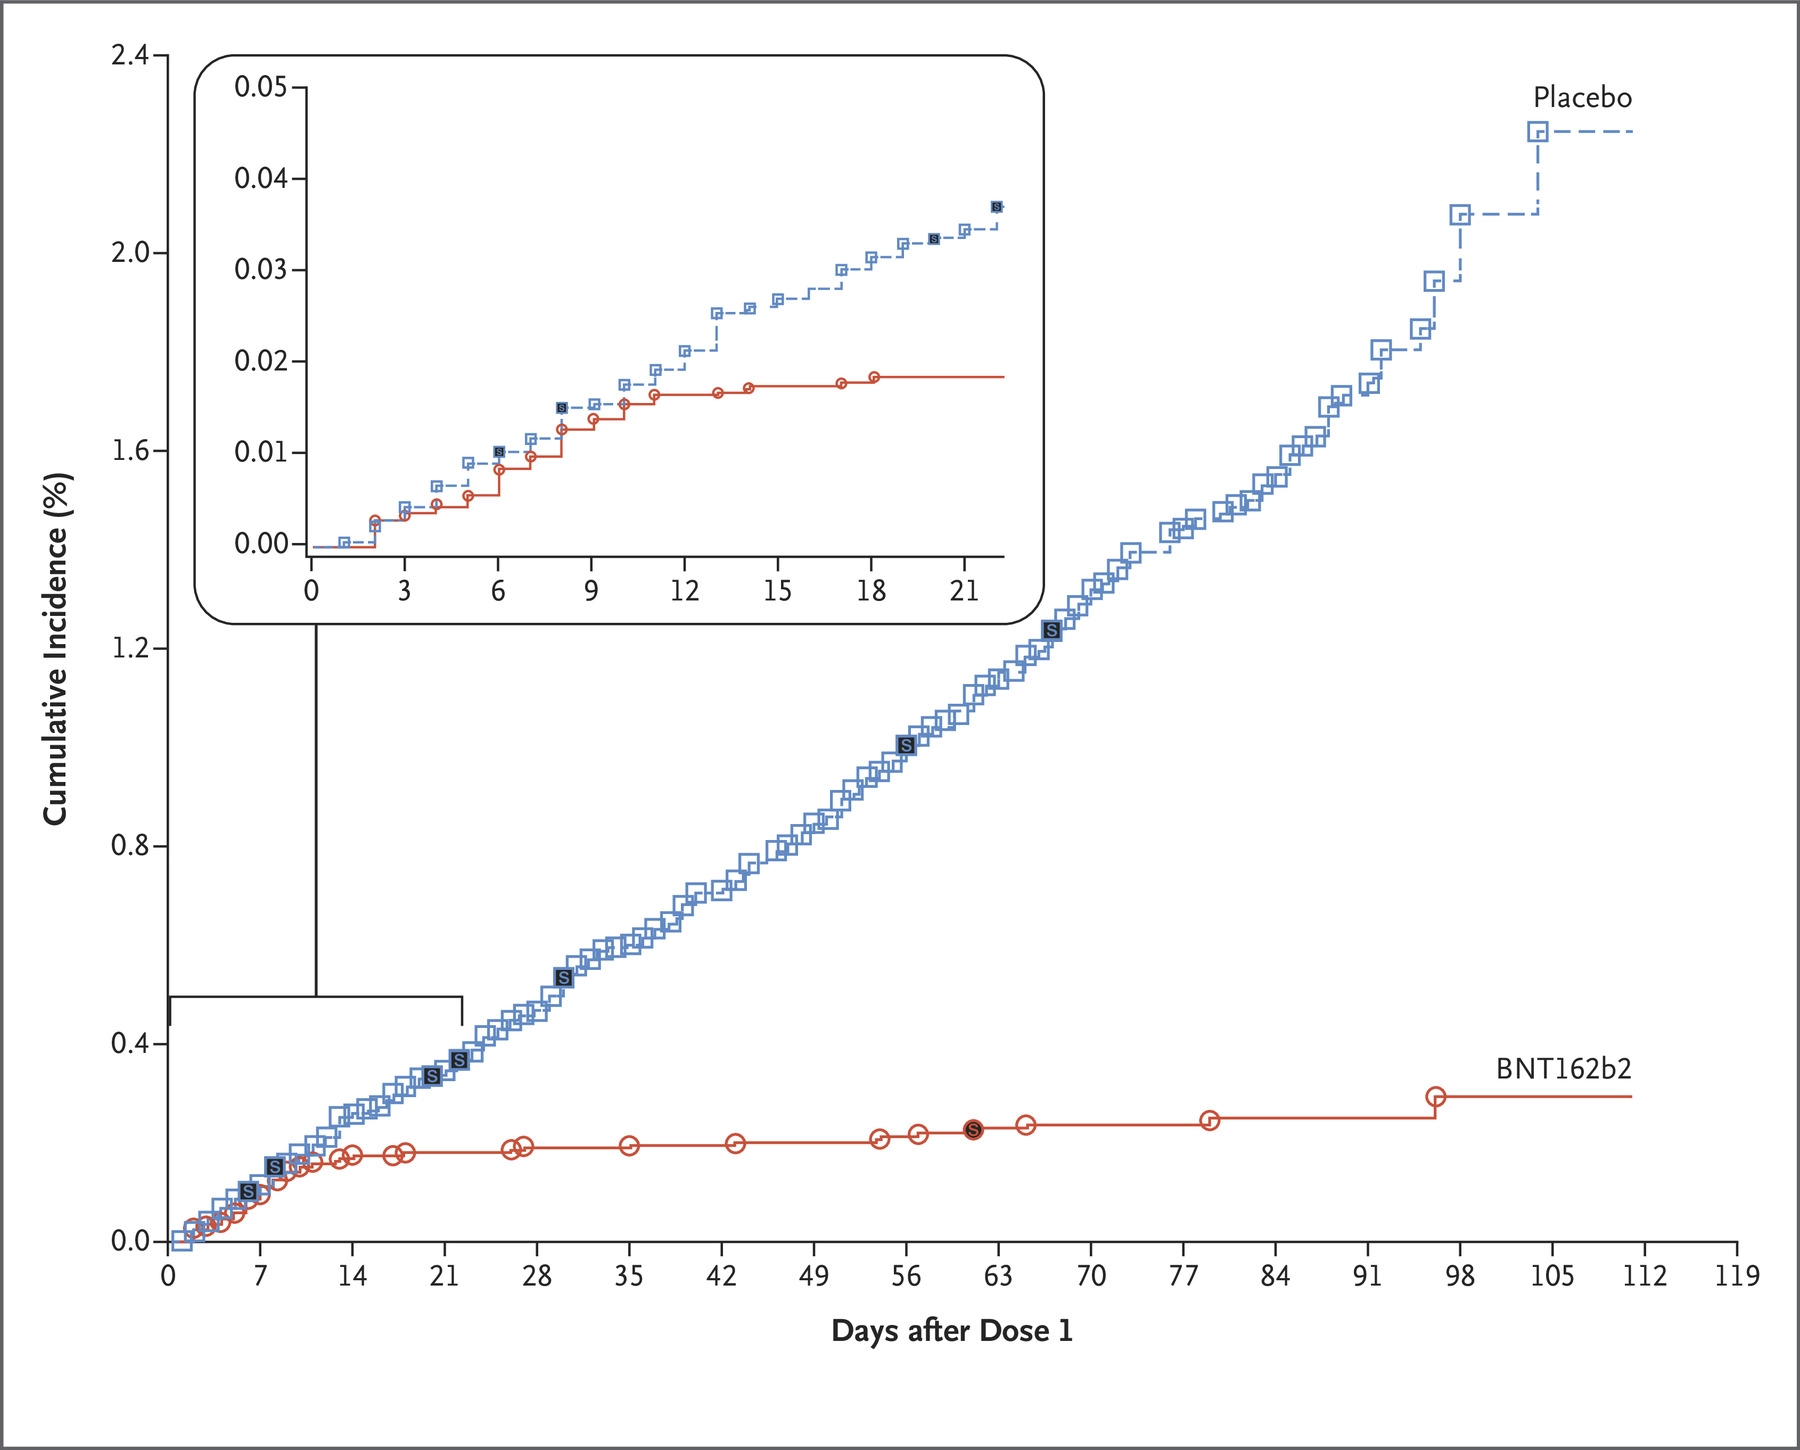
The volunteers who were given a placebo shot appear as the blue line. The ones who got a vaccine are in red. Each time either line jumps up, that’s when a new covid-19 case occurred.
What the data shows is that during the first week after getting their shots, both groups of people kept getting covid-19 at about the same rate. But after that, the lines start to separate. And they just keep separating and separating.
That’s the result of the vaccine taking effect, which usually takes a few days and gets boosted by a second dose. After two weeks, hardly anyone with the vaccine was getting covid-19. But the disease kept striking those who got the placebo with clockwork regularity.
“No comment. This is what vaccines do,” said Florian Krammer, a prominent immunologist, who posted a version of the image to Twitter.
The triumphalism is justified. This is what the researchers have been working toward all year. And the data in this graphic leaves no room for rumors, politics, or uninformed commentary. It’s as plain as day: this vaccine is one of the best we’ve ever seen.
Pfizer presented the chart in a paper published on December 10 in the New England Journal of Medicine and earlier in the week as part of its application to the US Food and Drug Administration to begin selling the vaccine. That authorization could be given at any moment now that the agency’s advisors have voted in favor.
The stark nature of Pfizer’s proof will be more important than ever as the vaccine starts to reach clinics and hospitals. Anti-vaccination forces are shouting through bullhorns on social media to stir fears over the shot, and even ordinary people are wondering if they should get it.
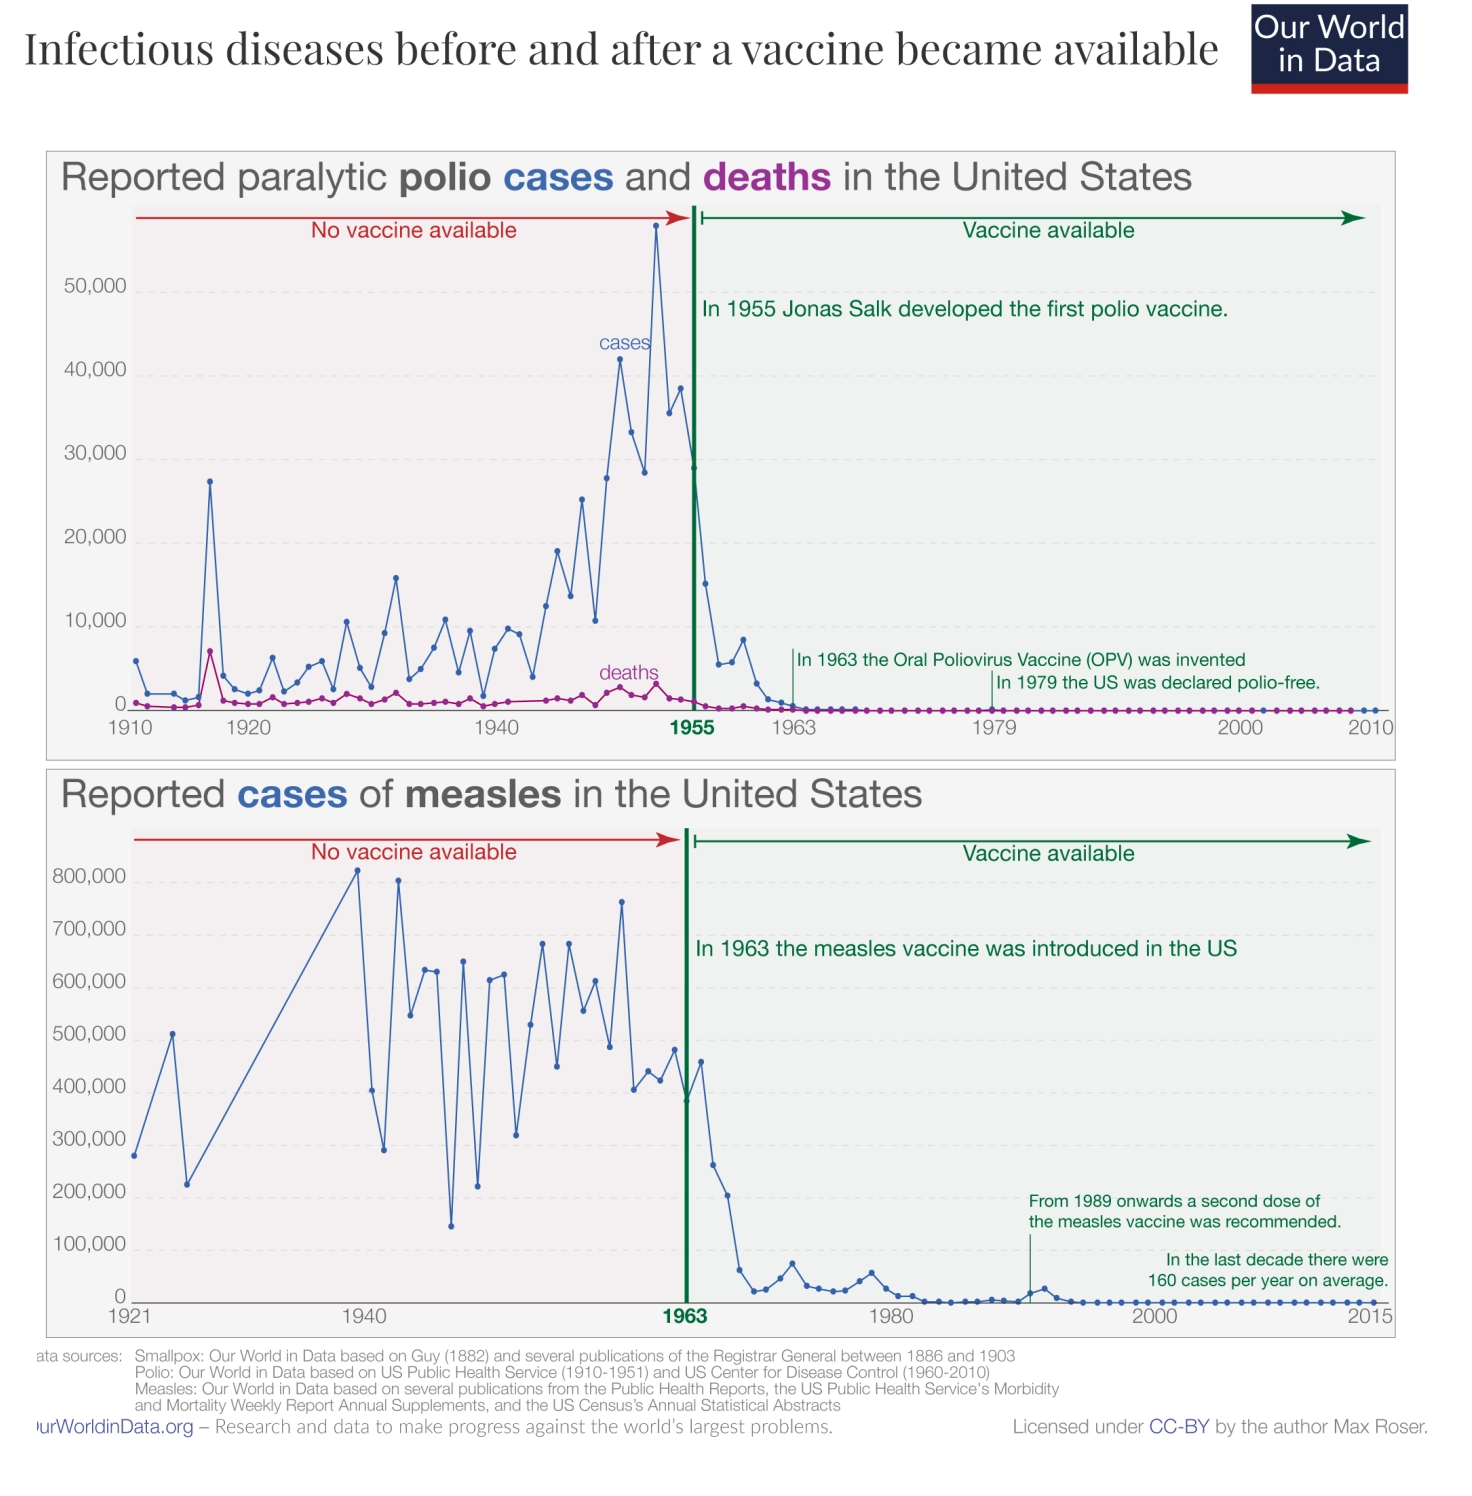
Researchers have known all along that vaccines can rapidly turn infectious diseases from scourges to bad memories. Since they were first developed, and especially during the 20th century, the transformative effects of vaccines have been witnessed again and again.
These charts from Our World in Data show what happened after the introduction of the vaccines for polio and measles. Polio put kids in iron lungs and scared parents away from pools. Then, in a matter of a few years, the fear was gone.
There are still unknowns. How long does protection from covid-19 last? No one knows; there have been encouraging signs recently that immunity may last years in people who have had the disease, but it’s too early to say for certain. Moreover, limited supplies mean that, at least in the US, much of the public won’t get a vaccine until toward the middle of 2021. It could be 2022 before most of the world is vaccinated, according to the World Health Organization.
Since the beginning of the pandemic, case curves and death curves have been our daily reminder that it isn’t over—and lately, that it’s getting worse. The phrase “grim milestone” shows up regularly in news reports. More than 3,000 Americans died in a single day this week from covid-19.
Pfizer’s chart is the antidote to those death curves. It shows how we can get off the roller coaster. As people become vaccinated with its shot (or those from other companies), more and more of us will be living on the safe and protected red curve, not the fearful blue one where covid-19 can strike at any time.
This is the graphic of the year. It’s what getting back to normal looks like.
Deep Dive
Biotechnology and health
How scientists traced a mysterious covid case back to six toilets
When wastewater surveillance turns into a hunt for a single infected individual, the ethics get tricky.
An AI-driven “factory of drugs” claims to have hit a big milestone
Insilico is part of a wave of companies betting on AI as the "next amazing revolution" in biology
The quest to legitimize longevity medicine
Longevity clinics offer a mix of services that largely cater to the wealthy. Now there’s a push to establish their work as a credible medical field.
There is a new most expensive drug in the world. Price tag: $4.25 million
But will the latest gene therapy suffer the curse of the costliest drug?
Stay connected
Get the latest updates from
MIT Technology Review
Discover special offers, top stories, upcoming events, and more.