How Google Street View Images Reveal the Demographic Makeup of the U.S.
Each year, the U.S. Census Bureau spends $1 billion surveying the population. These surveys are designed to tease apart the demographic makeup of the country by asking a representative group of people about their race, gender, education, occupation, and so on. This is an important exercise because it gives a crucial bird’s-eye view of the population and how it is changing.
But it is not easy. For a start, the data is relatively large scale—the Census Bureau’s main survey, the American Community Survey, gives results for all cities and counties with a population greater than 65,000. Smaller areas don’t figure.
What’s more, surveying the population is a time-consuming exercise; so much so that some data can be five years old by the time it is published. And because other data is much newer, comparisons can be problematic.
So demographers would dearly love to have a faster, more efficient, and higher-resolution way of studying the population.
Enter Timnit Gebru at Stanford University and a few pals, who have used Google Street View images to make remarkably accurate assessments of the demographic breakdown in a wide range of U.S. cities. Their technique shows how demographers can collect reliable data in an entirely new way that complements and improves on current methods.
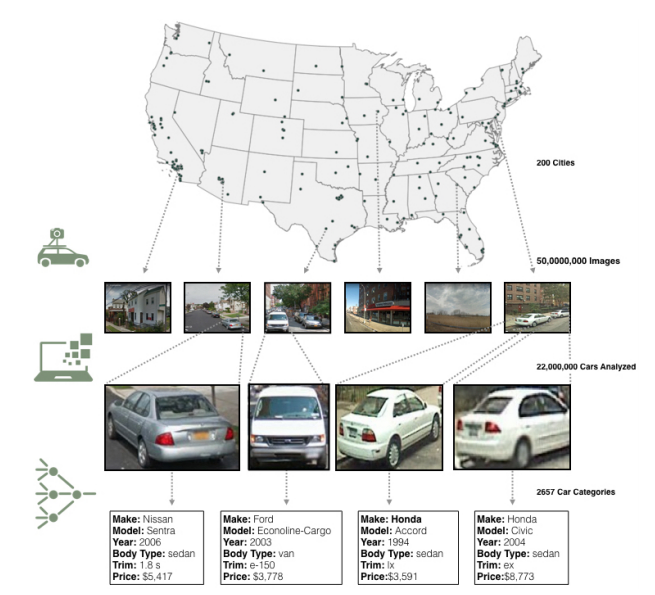
Gebru and co begin with 50 million Street View images gathered by Google’s cars in 200 American cities. The team believes the type of car people own is a strong indicator of their race, income, education levels, occupation, and so on.
So Gebru trained a set of machine-vision algorithms to recognize cars in these images and then classify each in one of 2,657 different categories that depend not only on the make and model of the car but also its age. This gives an accurate idea of the car’s worth.
In total, they classified some 22 million vehicles, about a third of all vehicles on the road in these cities. And it took their machine about two weeks to do the task at a rate of about 0.2 seconds per vehicle. “A human expert, assuming 10 seconds per image, would take more than 15 years to perform the same task,” say Gebru and co.
But how does the population of vehicles in an area relate to the local demographics? To find out, the team trained another deep-learning algorithm to learn the correlation between vehicle types and the data from U.S. Census and presidential election voting patterns in each precinct (an area of about 1,000 people). This training data set consisted of the data from 35 cities.
They then used the rest of the data to test the deep-learning algorithm. The question they wanted to answer was: given the pattern of vehicles in an area, could the algorithm accurately predict the demographics as recorded in the U.S. Census and presidential voting data?
It turns out that the deep-learning algorithm can do this remarkably well. “Using the classified motor vehicles in each neighborhood, we infer a wide range of demographic statistics, socioeconomic attributes, and political preferences of its residents,” they say.
For example, sedans are most closely associated with Democrats, while extended cab pickups are more closely associated with precincts that voted Republican. “We found that by driving through a city for 15 minutes while counting sedans and pickup trucks, it is possible to reliably determine whether the city voted Democratic or Republican,” say Gebru and co.
An important question is how well these conclusions match those gathered by surveys in the conventional way. To find out, Gebru and co compared their results with those from the U.S. Census Bureau’s own data from the American Community Survey. And they found a strong correlation with demographic factors such as income, education, occupation, and so on. They were even able to make fine-grained predictions about voter preferences at the level of precincts, which encompass about 1,000 people.
The American Community Survey is likely to remain the gold standard for data collection, at least for the time being. But the ability to gather high-quality data quickly using Google Street View has great potential to provide almost real-time monitoring of changes in the population.
And of course, Google is not the only organization collecting images of the streets—it’s not hard to imagine the same process being applied to images from Facebook, Twitter, or other social media networks that are geotagged and date-stamped.
Ref: arxiv.org/abs/1702.06683: Using Deep Learning and Google Street View to Estimate the Demographic Makeup of the US
Keep Reading
Most Popular
Large language models can do jaw-dropping things. But nobody knows exactly why.
And that's a problem. Figuring it out is one of the biggest scientific puzzles of our time and a crucial step towards controlling more powerful future models.
The problem with plug-in hybrids? Their drivers.
Plug-in hybrids are often sold as a transition to EVs, but new data from Europe shows we’re still underestimating the emissions they produce.
Google DeepMind’s new generative model makes Super Mario–like games from scratch
Genie learns how to control games by watching hours and hours of video. It could help train next-gen robots too.
How scientists traced a mysterious covid case back to six toilets
When wastewater surveillance turns into a hunt for a single infected individual, the ethics get tricky.
Stay connected
Get the latest updates from
MIT Technology Review
Discover special offers, top stories, upcoming events, and more.