Sponsored
Spark at the Center of a Technology Revolution
Provided byIBM
Most of us in the tech business are familiar with Moore’s Law. For those of us who are not, the law states that the number of transistors or processing power per square inch on integrated circuits doubles each year since their invention. This trend led first to the emergence of personal computers and smartphones, and now to the Internet of Things. 1 in 5 people globally now have a personal computer, and in the U.S., 4 in 5 people do. In the case of mobile, 1 in 2 people globally have a smartphone, and in the U.S., 3 in 4. Looking through even the small window we have for the potential of the IOT, it’s clear that the digital, connected world we all live in is positioned to reinvent business, science, and society.

All of our connected devices are fueling a growth in data that is completely new to everyone. Starting 3 years ago, we generated more data than we created in the 199,997 years of human history leading up to that point. What this starburst of data means is that how we think about data and technology needs to change at the most fundamental level. It’s not just a question of scale—the types of data and the potential for the way they impact human life and the globe are different at the core. Traditional approaches are either not going to function with the new, massive amounts of data, or they are not going to produce results that are relevant in a world where real-time feedback from devices wired into everything from human heartbeats to interstellar data is flowing constantly and at an increasing rate.
For example, we can no longer try to transform data before loading it into an analytics environment. We cannot move data around to analyze it, nor can we query data with preconceived questions as there are too many variables to think about.
u2028Read more content provided by IBM:
IBM and Linux Advancing the Open Source Revolution
Fortunately, at the same time as this data explosion is happening all around us, the barriers to working with data and data technology are lowering at an amazingly fast rate.
Everyone now has access to the information, the technology, and the tools needed to extract as yet untapped value from this explosion of data. To prove this out, I’ve plotted trend data I aggregated from sources on the web.
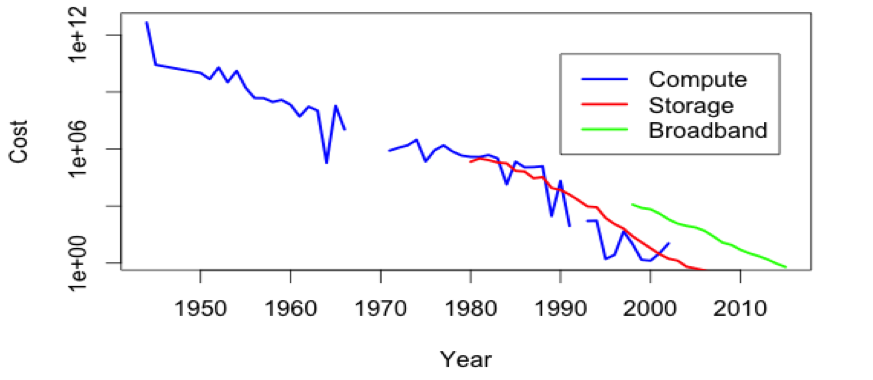
The cost of compute, storage, and broadband—required to work with data and perform analytics—is economically zero. Access to technology alone is not in itself valuable.
To derive insight from all of this data requires the invention of new disciplines. The aptly named field of Data Science has emerged, and the new roles of the Data Engineer and the Data Scientist are in a state of evolution, with boundaries and skills fluctuating and growing as new data technologies like machine learning and distributed computing emerge. Each role has its own set of competencies that in many ways is turning the current state of analytics best practices on its head.
First, get used to the idea of fuzzy math (probability) and even fuzzier insights (accuracy: they’re becoming the norm, not the exception. The next upheaval: how we take these insights and turn them into action. This is where Apache Spark comes in. Spark makes use of the new trends in data science and creates what I consider the Analytics Operating System to program data into insight. The end goal: applications powered by deep intelligence.
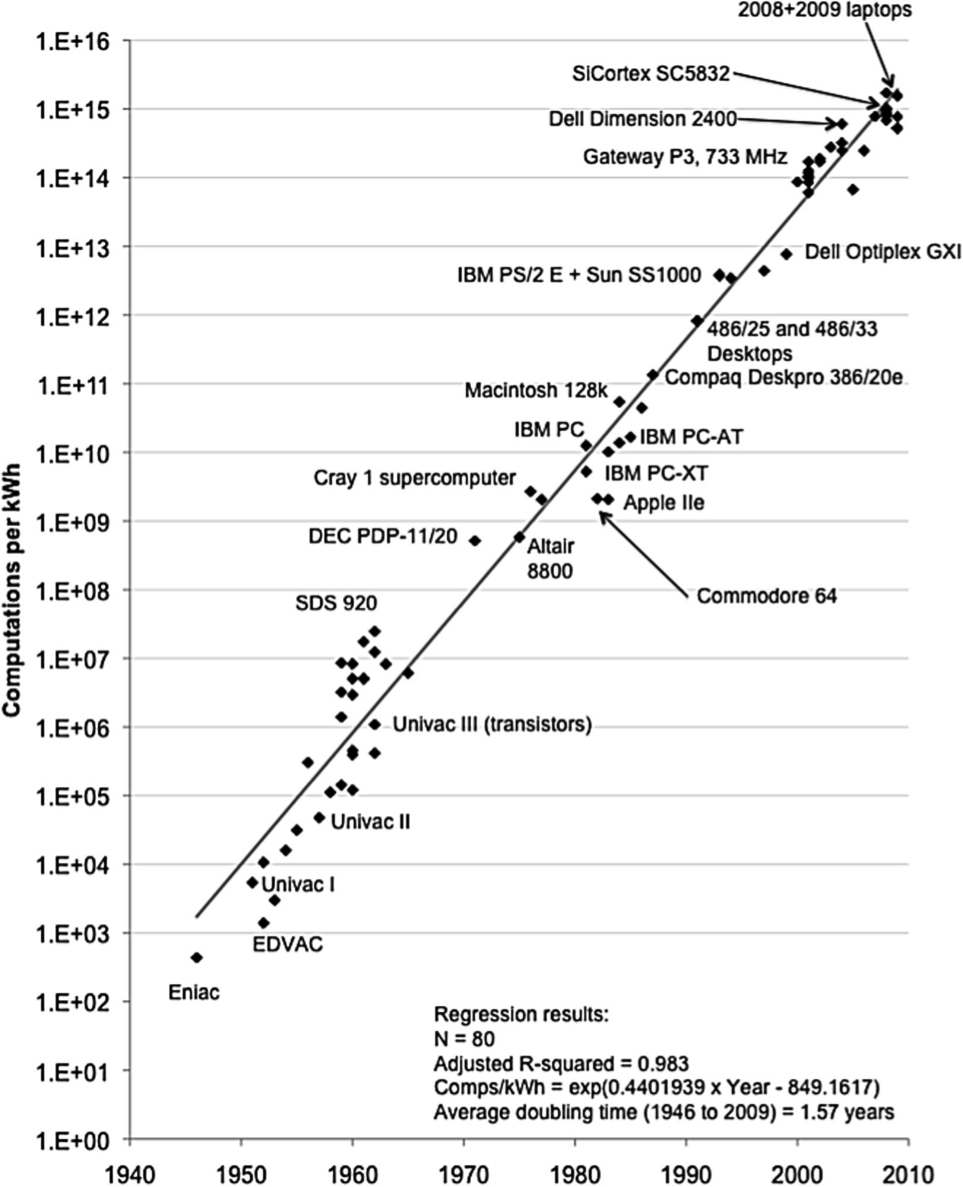
Driving demand for intelligent applications is the Internet of Things. The IOT is the next step in the reach of analytics: intelligence built into everything. Driving this mega trend is the increase in the amount of computation per kwh that is going up as we improve energy efficiencies—explained elegantly in this paper by Jonathan G. Koomey: electrical efficiency of computation has doubled roughly every year and a half for more than 6 decades.
Over time, we will look back and see this year, 2015, as the year we made a fundamental shift in our thinking from simply discovering insights to applying them on a massive scale and in ways that produce insights we can’t at this point imagine. We’ll no longer consider insights derived from data as information visualized on a dashboard. Insights derived from data are the true source of the next industrial revolution: the insight economy. I for one am excited for all of us, as we’re increasingly connected to devices and to each other around the globe, to stop slashing our way through a randomly-generated jungle of data, and instead to have insight delivered to us in the moment where we need it the most.
You can find the details of my data sources and simple visualization analysis below.
## datasets
http://www.mkomo.com/cost-per-gigabyte
http://drpeering.net/white-papers/Internet-Transit-Pricing-Historical-An...
http://www.jcmit.com/cpu-performance.htm
https://www.dropbox.com/s/f7ag8zkkerqcnak/tech_cost_trends.csv?dl=0
## technology trends analysis
techdata = read.csv(“data/tech_cost_trends.csv”)
## visualize in trendline
plot(techdata$Year,techdata$Cost.of.Performance, type=”n”, xlab=”Year”,ylab=”Cost”, log=”y”)
lines(techdata$Year,techdata$Cost.of.Performance, col=”blue”, lwd=2.5)
lines(techdata$Year,techdata$Cost.of.Storage, col=”red”,lwd=2.5)
lines(techdata$Year,techdata$Cost.of.Transfer, col=”green”,lwd=2.5)
leg.txt <- c(“Performance”, “Storage”, “Transfer”)
legend(1990,1e+11, legend=leg.txt, lty=c(1,1), lwd=c(2.5,2.5),col=c(“blue”,”red”,”green”))
## visualize in ggplot
g <- ggplot(techdata, aes(techdata$Year))
g <- g+ geom_line(aes(y=techdata$Cost.of.Performance), colour=”blue”)
g <- g+ geom_line(aes(y=techdata$Cost.of.Storage), colour=”red”)
g <- g+ geom_line(aes(y=techdata$Cost.of.Transfer), colour=”green”)
g
For information on IBM’s new Spark Technology Center, click here
Keep Reading
Most Popular
Large language models can do jaw-dropping things. But nobody knows exactly why.
And that's a problem. Figuring it out is one of the biggest scientific puzzles of our time and a crucial step towards controlling more powerful future models.
The problem with plug-in hybrids? Their drivers.
Plug-in hybrids are often sold as a transition to EVs, but new data from Europe shows we’re still underestimating the emissions they produce.
Google DeepMind’s new generative model makes Super Mario–like games from scratch
Genie learns how to control games by watching hours and hours of video. It could help train next-gen robots too.
How scientists traced a mysterious covid case back to six toilets
When wastewater surveillance turns into a hunt for a single infected individual, the ethics get tricky.
Stay connected
Get the latest updates from
MIT Technology Review
Discover special offers, top stories, upcoming events, and more.