Data Mining Reveals a Global Link Between Corruption and Wealth
One question that social scientists and economists have long puzzled over is how corruption arises in different cultures and why it is more prevalent in some countries than others. But it has always been difficult to find correlations between corruption and other measures of economic or social activity.
Michal Paulus and Ladislav Kristoufek at Charles University in Prague, Czech Republic, have for the first time found a correlation between the perception of corruption in different countries and their economic development.
The data they use comes from Transparency International, a nonprofit campaigning organisation based in Berlin, Germany, and which defines corruption as the misuse of public power for private benefit. Each year, this organization publishes a global list of countries ranked according to their perceived levels of corruption. The list is compiled using at least three sources of information but does not directly measure corruption, because of the difficulties in gathering such data.
Instead, it gathers information from a wide range of sources such as the African Development Bank and the Economist Intelligence Unit. But it also places significant weight on the opinions of experts who are asked to assess corruption levels.
The result is the Corruption Perceptions Index ranking countries between 0 (highly corrupt) to 100 (very clean). In 2014, Denmark occupied of the top spot as the world’s least corrupt nation while Somalia and North Korea prop up the table in an unenviable tie for the most corrupt countries on the planet.
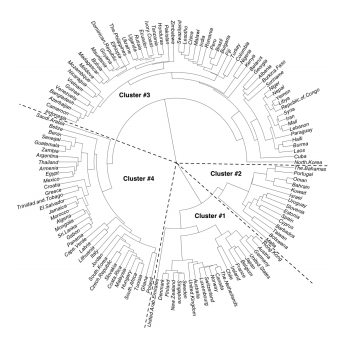
Paulus and Kristoufek use this data to search for find clusters of countries that share similar properties using a new generation of cluster-searching algorithms. And they say that the 134 countries they study fall neatly into four groups which are clearly correlated with the wealth of the nations within them.
The method that makes this possible is known as the average linkage clustering approach. It begins by assuming that each country represents a cluster in itself and then looking for the nearest neighbour in the ranking. This pair then become a new cluster and this cluster placed back into the list as a single entity. The process is then repeated until it produces a single cluster of all the countries.
From this, it is a simple matter to draw a tree diagram showing how the clusters are related. The researchers connect the ends of the diagram to make it into circle, as shown above. It’s then straightforward to see how the clusters are grouped.
Paulus and Kristoufek say the technique reveals four clear clusters. The first consists of developed countries such as the US, UK, the western states of the EU, Japan, Australia, New Zealand, Singapore and so on. Their average corruption rating is low at 83.
This cluster is separated by a significant distance from the other clusters. The countries are all rich with an average GDP per capita of $52,138. It contains no African countries and only one from South America in Chile, the region’s most developed nation. “In other words, the cluster of the least corrupt countries is composed of the most developed nations across all continents,” say Paulus and Kristoufek.
The second cluster has greater variety. It is composed of various countries from Europe such as Malta, Slovenia, Cyprus, Spain and Portugal. It has several African countries such as Botswana and a mini-cluster of oil exporting countries such as Oman and Kuwait. This cluster has higher levels of corruption with an average rating of 59 and an average GDP per capita at $23,521.
The next cluster is still more corrupt with a ranking of 41 and less rich with an average GDP per capita of $9751. It has a diverse list of members including the post-communist countries of eastern Europe, such as the Czech Republic, Poland and Latvia. It includes most of the countries in North Africa, such as Morocco, Egypt and Tunisia. And curiously, Greece and Italy fall into this category too, perhaps reflecting some of the economic problems that have bedevilled these nations.
The final cluster is largest and also the most corrupt, consisting of 60 countries with an average corruption ranking of 24. “The basket of countries is quite diverse here ranging from the new EU members (Bulgaria and Romania) to Russia and countries in between (Belarus, Moldova, the Ukraine) to China and India as well many African, Asian and a few Latin American countries,” say Paulus and Kristoufek. Various authoritarian regimes also fall into this category, such as Syria, Iran, North Korea and so on.
This cluster is the least rich with an average GDP per capita of $3,888. However it is also hugely diverse in this respect containing Russia with a GDP per capita of $14,090 and Malawi with GPD per capita of only $287.
Paulus and Kristoufek say the link between the perception of corruption and the wealth of the nation, as measured by its GDP per capita, is clear. “The ranking of countries according to their corruption perfectly copies the ranking according to the economic performance measured by the gross domestic product per capita.”
That’s an interesting study that finds a correlation between this corruption index and economic performance for the first time. That’s important because social scientists have always struggled to understand the links between corruption and other measures of performance.
But there are limitations as well. Although Paulus and Kristoufek say the correlation is a clear, what causes this correlation is not clear. Are countries poor because they are corrupt or corrupt because they are poor?
This work says nothing about questions like this. However, it does provide a starting point for further research to investigate the nature of corruption and its link to economic performance.
Ref: arxiv.org/abs/1502.00104 : Worldwide Clustering Of The Corruption Perception
Keep Reading
Most Popular
Large language models can do jaw-dropping things. But nobody knows exactly why.
And that's a problem. Figuring it out is one of the biggest scientific puzzles of our time and a crucial step towards controlling more powerful future models.
The problem with plug-in hybrids? Their drivers.
Plug-in hybrids are often sold as a transition to EVs, but new data from Europe shows we’re still underestimating the emissions they produce.
Google DeepMind’s new generative model makes Super Mario–like games from scratch
Genie learns how to control games by watching hours and hours of video. It could help train next-gen robots too.
How scientists traced a mysterious covid case back to six toilets
When wastewater surveillance turns into a hunt for a single infected individual, the ethics get tricky.
Stay connected
Get the latest updates from
MIT Technology Review
Discover special offers, top stories, upcoming events, and more.