Urban "Fingerprints" Finally Reveal the Similarities (and Differences) Between American and European Cities
Travel to any European city and the likelihood is that it will look and feel substantially different to modern American cities such as Los Angeles, San Diego, or Miami.
The reasons are many. Most older European cities have grown organically, usually before the advent of cars, with their road layout largely determined by factors such as local geography. By contrast, the growth of many American cities occurred after the development of cars and their road layout was often centrally planned using geometric grids.
But while the differences are stark to any human observer, nobody has succeeded in finding an objective way to capture the difference. Today, that changes thanks to the work of Rémi Louf and Marc Barthelemy at the Institut de Physique Théorique about 20 kilometers south of Paris. They have found a way to capture the unique “fingerprint” of a city’s road layout and provide a way to classify and compare the unique layouts of cities all over the world for the first time.
Louf and Barthelemy began by downloading the road layouts from OpenStreetMap for 131 cities from all continents other than Antarctica.One objective way to assess road layout is to think of it as a network in which the nodes are junctions and road segments are the links in between.
The problem with this method is that the networks of most cities turn out to be remarkably similar. That’s because the topology captures the connectedness of a city but nothing about the scale or geometry of the layout. It is the scale and geometry of the layout that seem to be the crucial difference between cities that humans recognize.
Louf and Barthelemy’s breakthrough was to find a way of capturing this difference. Instead of examining the road layout, they look at the shapes of the spaces bounded by roads. In other words, they analyze the size and shape of the street blocks.
In a city based on a grid, these blocks will be mostly square or rectangular. But when the street layout is less regular, these blocks can be a variety of polygons.
Capturing the geometry of city blocks is tricky. However, Louf and Barthelemy do this using the ratio of a block’s area to the area of a circle that encloses it. This quantity is always less than 1 and the smaller its value, the more exotic and extended the shape. The researchers then plot the distribution of block shapes for a given city.
But this shape distribution by itself is not enough to account for visual similarities and dissimilarities between street patterns. Louf and Barthelemy point out that New York and Tokyo share similar shape distributions but the visual similarity between these cities’ layouts is far from obvious.
That’s because blocks can have similar shapes but very different areas. “If two cities have blocks of the same shape in the same proportion but with totally different areas, they will look different,” they say.
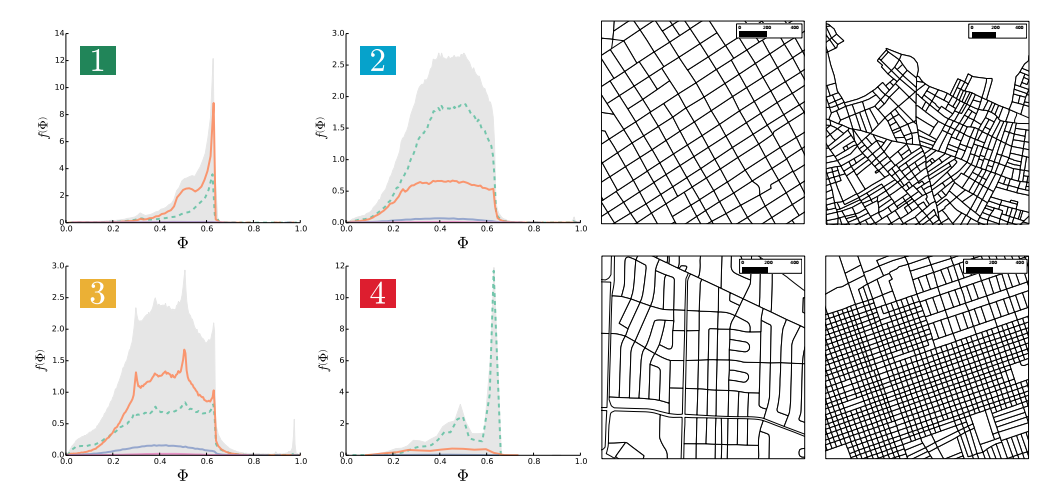
So the crucial measure that characterizes a city combines both the shape of the blocks and their area. To display this, Louf and Barthelemy arrange the blocks according to their area along the Y-axis and their shape ratio along the X-axis. The resulting plot is the unique fingerprint that characterizes each city.
When they did this for each of the 131 cities they had data for, they discovered that cities fall into four main types (see diagram above). The first category contains only one city, Buenos Aires in Argentina, which is entirely different from every other city in the database. Its blocks are all medium-size squares and regular rectangles.
An example from the second group is Athens in Greece. These cities are composed mostly of small blocks with a broad distribution of shapes.
Most cities that Louf and Barthelemy studied fall into the third group. Like the second group, the blocks in the cities have a broad distribution of shapes. However, they tend to be larger than the blocks in Athens.
This third group contains several subgroups. One of these contains 68 percent of all the American cities that Louf and Barthelemy studied. By contrast, all of the European cities, except Athens, fall into another subgroup. This “European” subgroup also contains Boston, Washington, Portland, Pittsburgh, Cincinnati, and Baltimore, which have a European flavor.
There is one final group, represented by Mogadishu in Somalia, made up almost entirely of small square-shaped blocks with a sprinkling of small rectangles.
Louf and Barthelemy then go further and study the difference between neighborhoods in a city, which can have dramatically different styles. A striking example of this is the Eixample district in Barcelona, which is very different from other parts of the city.
As an example, the researchers measured the unique fingerprints of the boroughs of New York City: the Bronx, Brooklyn, Manhattan, Queens, and Staten Island. They say that Staten Island and the Bronx have similar fingerprints. Manhattan has a unique fingerprint based on a grid structure dominated by two types of rectangles. Brooklyn and the Queens also have unique signatures reflecting the shape of the rectangles that make up their grid-like structure.
One limitation of this approach is how neighborhoods themselves are defined, usually as administrative districts rather than architectural ones. Louf and Barthelemy say an interesting avenue for future research would be to find a way of determining the boundaries of neighborhoods based on their layout classification.
The ability to classify cities in this way will come as something of a revelation to travelers who have long noticed the visual similarities and differences between cities all over the world. The inability to classify these associations has always been something of an embarrassment for city planners.
Now that it is possible, the applications are many. For example, it gives city planners a way of comparing their designs against existing cities and neighborhoods. A planner wanting to reproduce the neighborhood structure of San Francisco while avoiding the structure of Kansas City, now has a way to objectively assess future designs. Equally, anybody wanting to move to a neighborhood similar to one they already like now has a way of comparing and assessing their options.
It may also allow other kinds of “city science.” An interesting approach might be to look for correlations between crime and certain types of neighborhood layout.
There is clearly plenty of fun to be had with emerging discipline of city science in the next few years.
Ref: arxiv.org/abs/1410.2094 : A Typology of Street Patterns
Keep Reading
Most Popular
Large language models can do jaw-dropping things. But nobody knows exactly why.
And that's a problem. Figuring it out is one of the biggest scientific puzzles of our time and a crucial step towards controlling more powerful future models.
The problem with plug-in hybrids? Their drivers.
Plug-in hybrids are often sold as a transition to EVs, but new data from Europe shows we’re still underestimating the emissions they produce.
Google DeepMind’s new generative model makes Super Mario–like games from scratch
Genie learns how to control games by watching hours and hours of video. It could help train next-gen robots too.
How scientists traced a mysterious covid case back to six toilets
When wastewater surveillance turns into a hunt for a single infected individual, the ethics get tricky.
Stay connected
Get the latest updates from
MIT Technology Review
Discover special offers, top stories, upcoming events, and more.