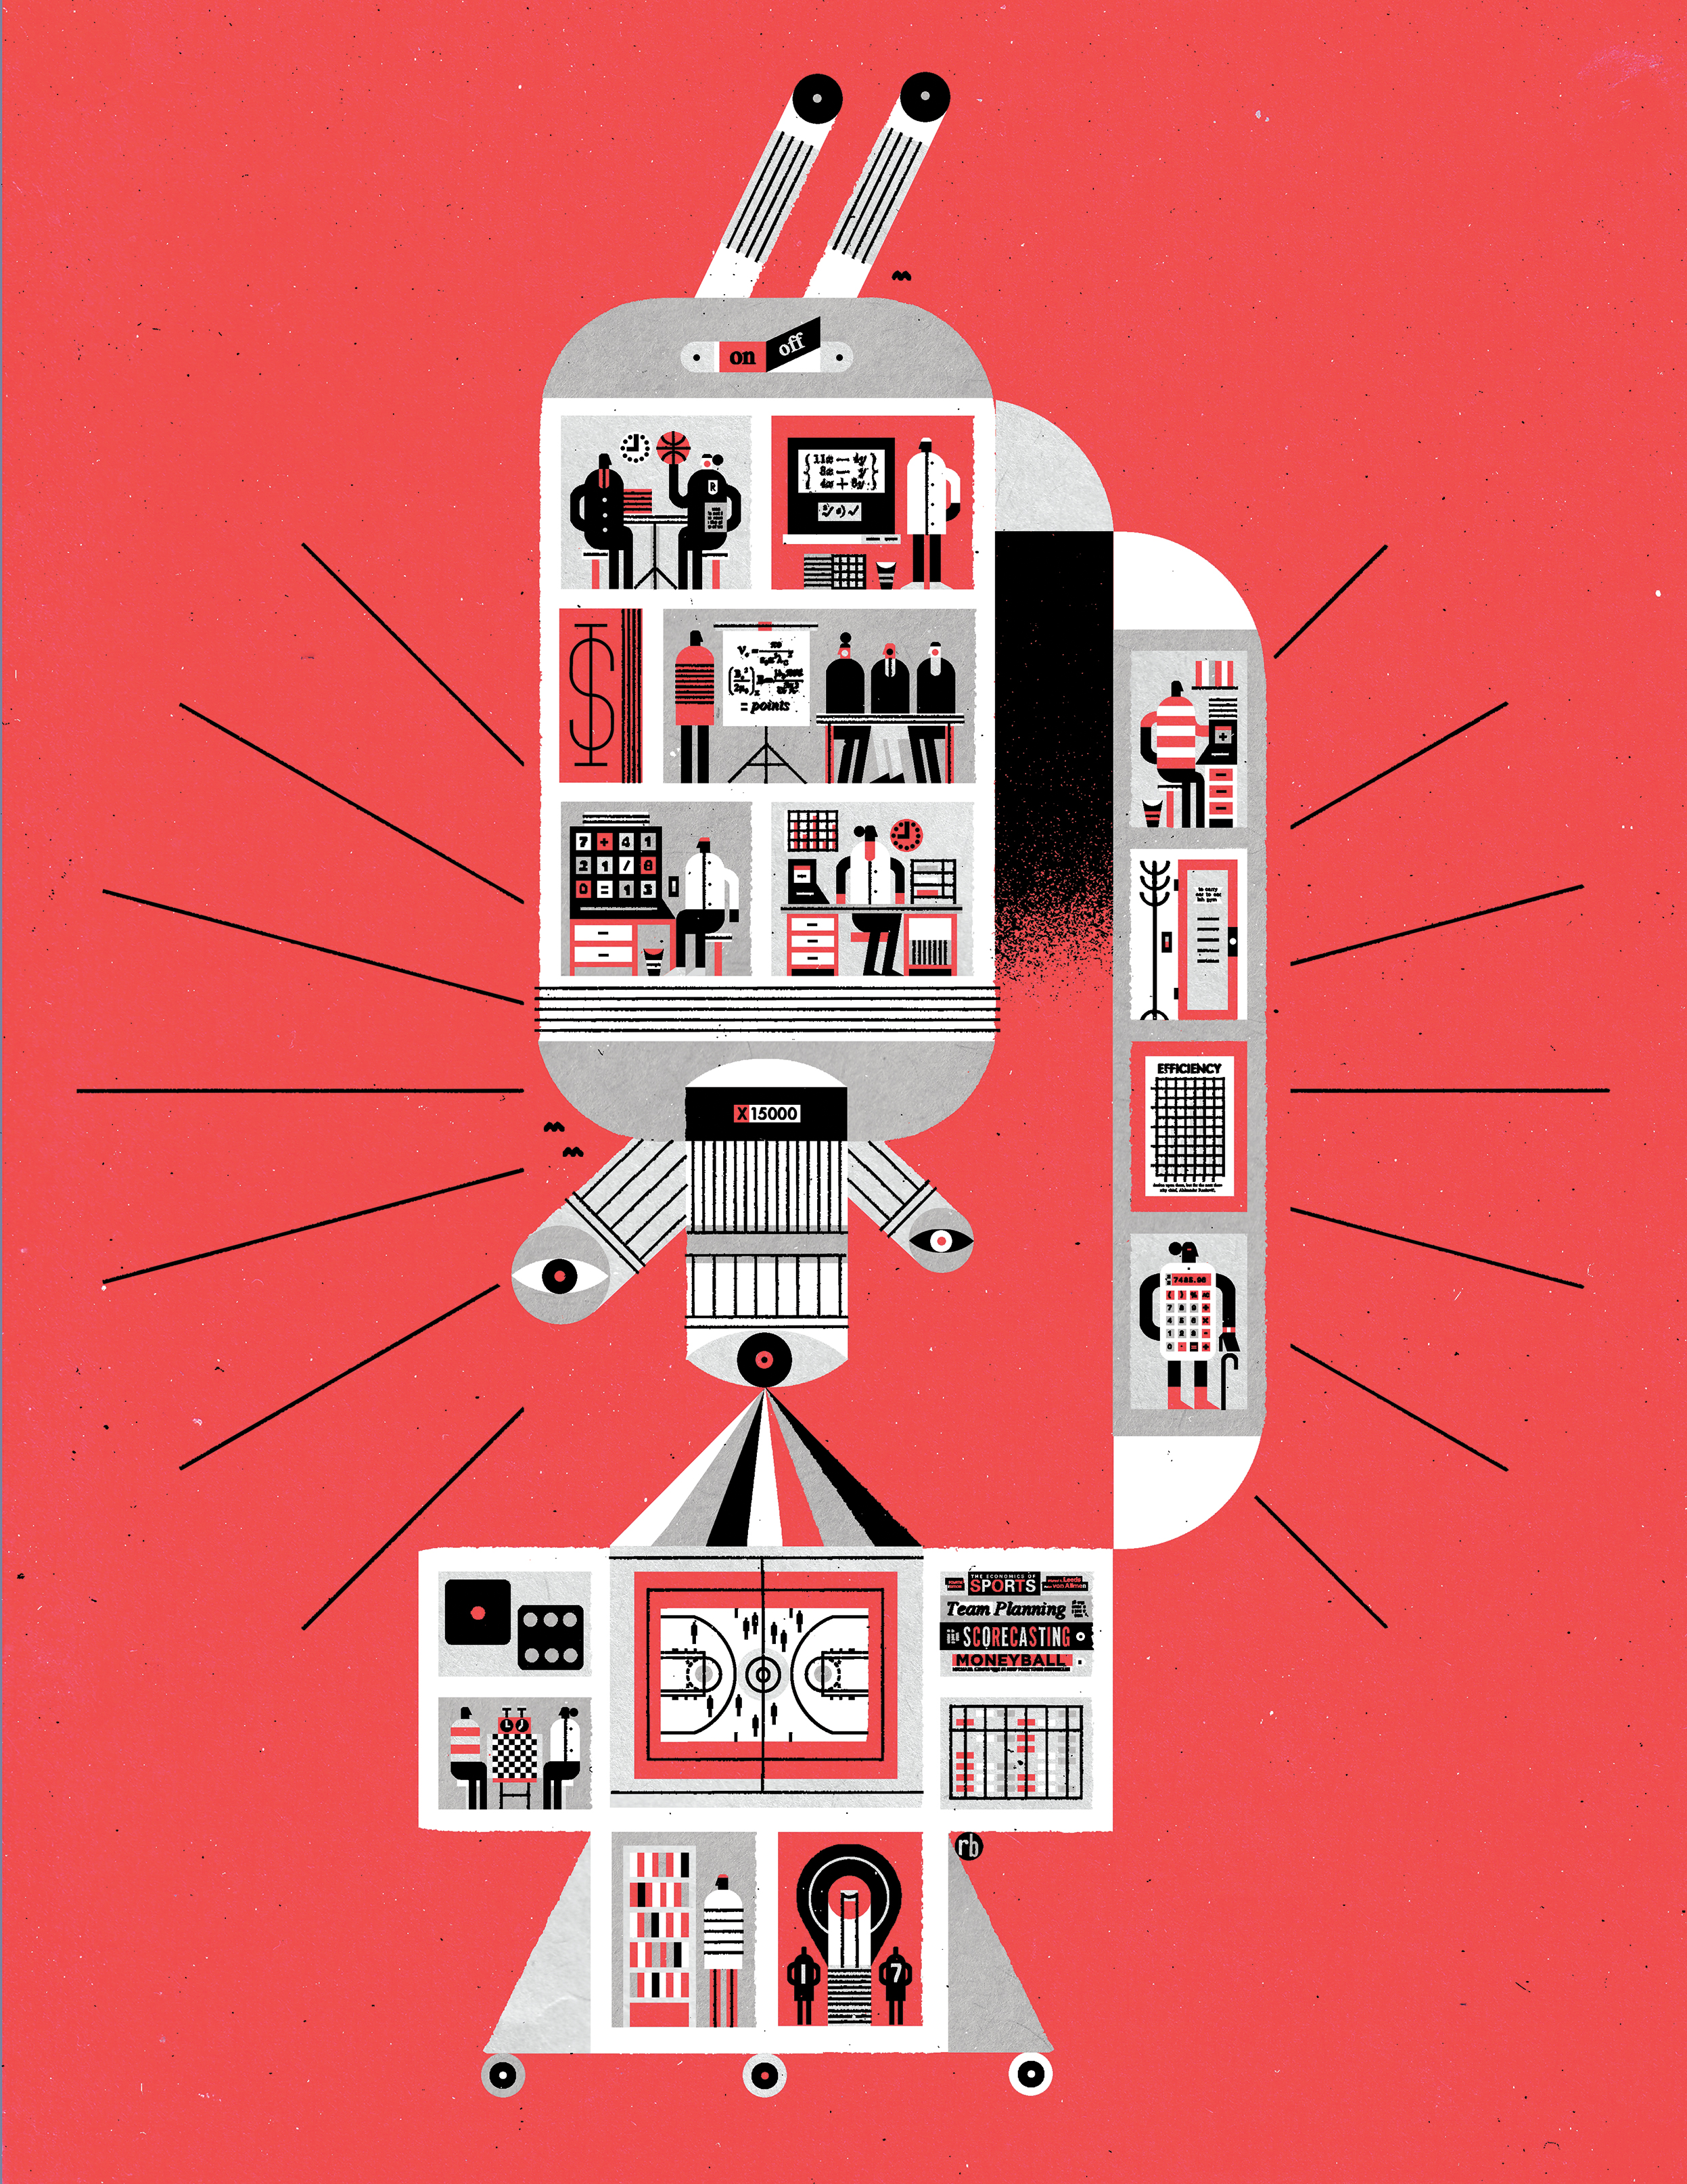
Rewriting the Playbook
Back in 2011-12, the Houston Rockets were a mediocre team that had a 34–32 record and missed the NBA playoffs. After the season, they unloaded their top six scorers. But instead of getting worse, Houston improved. In 2012-13 the team made the playoffs with a 45–37 record, largely thanks to some unorthodox players their general manager imported in the off-season.
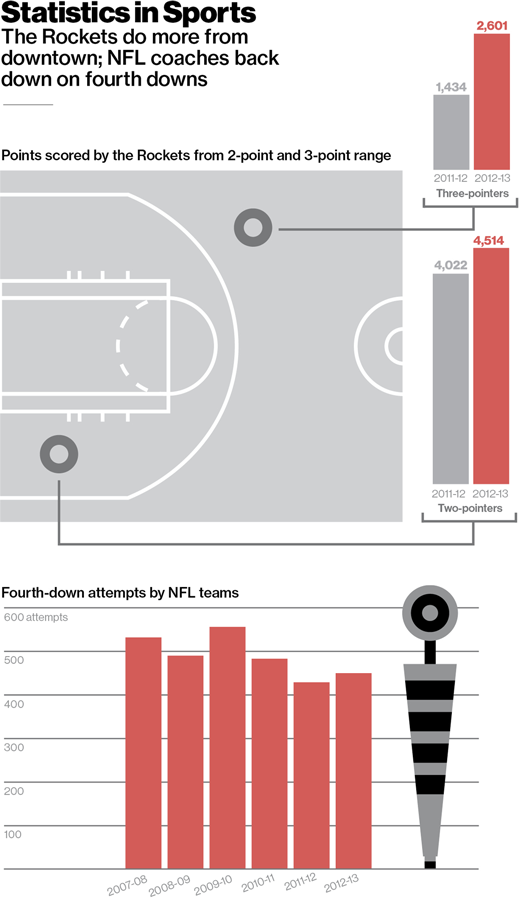
A key to the Rockets’ success was their retooled offense: they launched the second-highest number of three-point shots in NBA history while taking a lower proportion of long-range two-point shots than any other team ever. That kind of approach has earned the approval of basketball nerds, who figured out years ago that three-point attempts are among the highest-yield shots in the sport, and long two-point shots are the lowest.
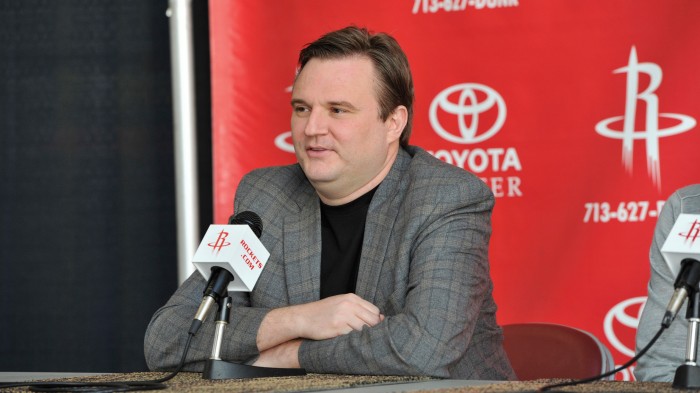
As it happens, Houston’s general manager is a basketball nerd: Daryl Morey, SM ’00. Unlike many other basketball executives, Morey is not a former NBA player. He worked for a sports analytics firm and got an MBA from MIT before working in pro basketball. Thus the Rockets’ style of offense is no accident. Shooting guard James Harden, the star Morey cannily acquired before the 2012-13 season, is known for his three-point accuracy and his creative drives to the hoop. Center Omer Asik, another acquisition, limits himself to high-percentage shots near the basket and ranks fourth in the league in offensive rebounds, giving his team additional scoring opportunities. With their help, the Rockets made about 51 percent of their two-point shots in the 2013 season—and about 37 percent of their three-pointers, which yielded an even higher rate of return.
The evolution of the Rockets’ offense demonstrates the impact that sports analytics has produced. At one time, this data crunching was mostly the province of amateur geeks and obsessive fans trying to figure out why things happened as they did—how teams won and lost games in the first place. Today, sports analytics is having a discernible effect on the way professional sports are played, and that influence is likely to increase. Compared with today’s overall style of play, “I think what teams are going to be running in 10 years will be totally different,” Morey said at this year’s MIT Sloan Sports Analytics Conference.
In 10 years, there may also be more MIT people working in professional sports. For a school not exactly known for generating professional athletes, MIT is having an outsize influence on sports analytics. Its annual conference is now the showcase event in the field, drawing 2,700 attendees in March this year. Several MIT graduates have already worked for pro franchises; many have produced original research.
For MIT-linked scholars, sports analytics is “more respectable” now than it once was, says Stephen Graves, a professor at Sloan who helped launch the conference. “The other thing is the quality and quantity of data,” Graves says. “Sports are data-rich. As a consequence it creates good research opportunities.”
The amateur spirit
For decades, few people pursued those research opportunities. But in the 1970s, a Kansas baseball fan named Bill James began self-publishing an annual book of statistical analysis, Baseball Abstract. From 1982 through 1988, James’s book was published nationally and gained a significant following. James had found that much of the conventional wisdom in baseball did not hold up to empirical study. Players reached their peaks earlier in their careers than most people realized. Players who drew a lot of walks were undervalued. The dimensions of a player’s home ballpark had a large impact on his statistics. Many minor-leaguers were about as good as many major-league players. In short, James argued, useful talent could be acquired cheaply—if you could recognize it.
By the 1990s, the Oakland Athletics were systematically trying to apply James’s insights. Those efforts became the subject of Michael Lewis’s 2003 best-seller Moneyball, which exponentially increased interest in sports analytics. Statistical research now exists in almost every popular sport, even mixed martial arts, and many teams have analytics operations.
Morey, for his part, got his undergraduate degree from Northwestern while also working for STATS Inc., an analytics firm James was involved with. Eventually, Sloan MBA in hand, he landed a job in the Boston Celtics’ front office and began teaching an MIT class about sports analytics on the side. When Morey got hired by the Rockets, teaching the class was no longer feasible, so he helped launch the annual conference instead.
The event brings together self-styled analytics outsiders who, as James did, have made a name for themselves before ever having formal employment in sports—along with team executives, coaches, and, increasingly, MBA students who want to enter the field.
“It’s the amateur statisticians or analysts who are really the foundation for this field and have done much of the ground-breaking and interesting work,” says Graves.
Many of those amateurs now happen to be people with advanced degrees. Graves himself recently helped develop a better way to measure the putting ability of golfers on the PGA Tour. The standard metric had been putts per round. But Graves and some other researchers recognized that some golfers hit approach shots consistently closer to the hole than others do, leaving them with shorter, easier putts. By using positional data that could specify the lengths of the putts all golfers faced and their proficiency in making them, Graves and his colleagues produced a better metric: “putts gained per round,” meaning the number of strokes saved in relation to the overall tour averages.
Or take Torin Clark, Aaron Johnson, and Alexander J. Stimpson, all aero-astro graduate students and self-described “sports geeks,” as Clark puts it. They produced a 2013 study using all 11,896 field goals attempted in the National Football League between 2000 and 2011. The students found that distance, generally regarded as the key determinant of success for field goals, is only one significant factor. A grass field, cold temperatures, rain, and a low-elevation setting all lower the odds that a kick will be converted. Sure, coaches may grasp intuitively that it is harder to make a field goal in bad weather, but the MIT researchers have discovered precisely how much harder: a 45-yard field goal kicked in the snow is 18 percent less likely to be good than a 45-yard attempt in dry 50° weather, for instance. And they ranked all 32 NFL stadiums in terms of difficulty for kickers. Green Bay’s Lambeau Field is currently the most difficult place to kick field goals, followed by Pittsburgh and Cleveland, while Denver is the most kicker-friendly locale in the NFL.
That paper was one of eight finalists in the competition at this year’s Sloan conference. The winner, nabbing a $10,000 prize, was produced by Douglas Fearing, PhD ’10, a professor at Harvard Business School, and Timothy Chan, PhD ’07, a professor at the University of Toronto, who first met in an operations research class at MIT. They estimated how much potential flexibility baseball teams have in terms of players who can play multiple positions, and how much value that versatility provides over a 162-game season in which almost every team suffers serious injuries. Tampa Bay’s Ben Zobrist, the researchers say, helped inspire the research. A shortstop who became a reserve outfielder, Zobrist blossomed into an All-Star in 2009, when he was asked to play second base in place of the injured Akinori Iwamura; he has since finished in the top 20 of the American League’s Most Valuable Player voting three times while frequently shifting between second base and the outfield, adding value through his versatility. Although Fearing usually studies airlines, he says they are like sports in that “they are both research environments in which there is a lot of data.”
Bad tactics, good career move
It is one thing to produce potentially valuable sports analytics work, however, and another thing to get players and coaches to take it seriously. In 2006 David Romer, PhD ’85, a macroeconomist at the University of California, Berkeley, and a football fan, published an unusual paper titled “Do Firms Maximize? Evidence from Professional Football.” As Romer showed, NFL teams were electing to punt or try for field goals on fourth downs in many situations when they should instead have risked trying for first downs or touchdowns. Or, as he wrote, “Teams’ choices on fourth downs differ from the choices that would maximize their chances of winning in ways that are systematic and overwhelmingly statistically significant.”
One football coach who read the paper was the New England Patriots’ Bill Belichick (an economics major in college at Wesleyan), who was already inclined toward the aggressive approach it supported. In 2009, in a high-profile regular-season showdown against the Indianapolis Colts, the Patriots were clinging to a 34–28 lead with a little more than two minutes left in the game when Belichick opted to go for it on fourth down, rather than punt, with the Patriots well inside their own territory. They failed to get the first down, leaving the Colts with a short drive for a touchdown—which Indianapolis promptly scored to win the game.
That decision triggered an avalanche of criticism, although the numbers showed it was highly defensible. Tellingly, NFL coaches faced with fourth downs are now going for first downs even less frequently than they were in 2009. If Belichick, football’s most highly lauded coach, faces such a backlash, few other coaches will buck convention.
“If we all listened to the professor, we may be all looking for professor jobs,” the former Pittsburgh Steelers coach Bill Cowher once told ESPN writer Greg Garber, when asked about Romer’s paper.
And yet there is evidence that many other coaches and players are using analytics. The Miami Heat’s LeBron James, arguably the world’s best basketball player, has adjusted his shot selection over the last few years on the basis of the numbers, telling a writer for the online publication Grantland this year that “the least efficient shot in our game is the midrange shot.” Kevin Durant of the Oklahoma City Thunder, by many measures the second-best player, has made similar comments. Graves says he has been told that some pro golfers use the new putting metrics to see which kinds of putts they are least good at relative to their competitors, in order to adjust their games.
Games and game theory
Still, sports analytics hasn’t answered every question. In sports where play advances through largely discrete actions, such as baseball or cricket, it is easier to quantify an individual’s contribution. In flowing team sports such as soccer, such quantification becomes much harder.
Basketball, for instance, is full of cause-and-effect tangles. Some players, like New York Knicks forward Carmelo Anthony, score a lot while maintaining lower shooting percentages than their teammates. But if the other Knicks were asked to shoot more, would their efficiency rates decline? In short, does Anthony shoot a lot out of selfishness or necessity?
“In all behavioral research, it is key to distinguish between correlation and causation,” says economist Tyler Williams, PhD ’13, who has written about sports analytics for ESPN the Magazine and who served as a judge for the research-paper competition at this year’s conference.
Or take an interesting finding from a paper presented at this year’s Sloan conference: some teams, including the Boston Celtics, were pursuing offensive rebounds at a suboptimal rate. That is, in an effort to prevent easy baskets by their opponents, they were spurning chances to gain more possessions overall and losing points in the trade-off. And yet, Williams notes, the aging Celtics might not have been able to get as many offensive rebounds as some competitors in any case.
“It might be wrong for other teams to crash the boards more based on this correlation,” Williams notes. The team’s capabilities might be the cause of the strategy, not the other way around.
And then there is the game-theory limitation of sports tactics. Strategies that work right now—like the Rockets’ current emphasis on three-point shooting—might become less effective as other teams adapt to them. If teams shoot more three-pointers, defenses will adjust, and the quality and efficiency of those three-point shots might diminish—perhaps leaving certain kinds of two-point shots undervalued. For that matter, the Rockets themselves keep evolving, having signed star center Dwight Howard this off-season. That may lead them to increase their proportion of two-point shots.
In this way sports analytics resembles, say, card games where the key is not finding one apparently eternal set of rules for success, but changing strategies over time. Indeed, Jeff Ma ’94, the former member of the MIT blackjack team that was the basis for the book Bringing Down the House and the film 21, has since worked in sports consulting.
“Every model that you make,” said Ma at this year’s Sloan conference, “you have to keep asking yourself: does it still apply?” The bad news for sports analysts is that any of their work might become obsolete in a few years. But the good news is that teams will have to keep employing a lot of them to determine whether it actually will.
Keep Reading
Most Popular
Large language models can do jaw-dropping things. But nobody knows exactly why.
And that's a problem. Figuring it out is one of the biggest scientific puzzles of our time and a crucial step towards controlling more powerful future models.
How scientists traced a mysterious covid case back to six toilets
When wastewater surveillance turns into a hunt for a single infected individual, the ethics get tricky.
The problem with plug-in hybrids? Their drivers.
Plug-in hybrids are often sold as a transition to EVs, but new data from Europe shows we’re still underestimating the emissions they produce.
Google DeepMind’s new generative model makes Super Mario–like games from scratch
Genie learns how to control games by watching hours and hours of video. It could help train next-gen robots too.
Stay connected
Get the latest updates from
MIT Technology Review
Discover special offers, top stories, upcoming events, and more.