Surfing Logs Reveal Global Eating Patterns
The web has turned out to be a rich resource for foodies. Cyberspace offers almost unlimited recipes, demonstration videos and online grocery stores. And there is no shortage of diet books for those who have overindulged.
So it’s no surprise that computational sociologists have begun to mine the data associated with our browsing habits to discover more about our diets and eating habits. Last year we looked at some fascinating work examining networks of ingredients and the flavours they contain, gathered from online recipe websites. It turns out this approach gives fascinating insights into the way recipes vary geographically and into the possibility of unexplored combinations of flavours.
Today, Robert West at Stanford University and Ryen White and Eric Horvitz from Microsoft Research in Redmond, take a deeper look at the electronic trails we leave when we hunt for food on the web. They say the data reveals important trends in the way our diets change with the season, with our geographical location and with certain special days such as Thanksgiving and Christmas. And they conclude that the data could become an important tool for monitoring public health.
These guys start with the assumption that the recipes people look at online are a reasonable proxy of what they actually eat. With that in mind, they looked at the online recipes visited between May 2011 and October 2012 by people all over the world who use a browser add-on provided by Bing and who have consented to the anonymous use of their data. This gave them a data set associated with billions of pages. They then worked out the nutritional content of each recipe and looked at how people’s interest varied throughout the year.
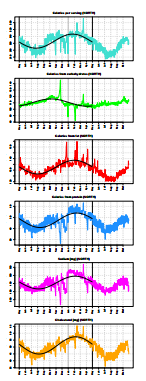
The results are a fascinating insight into people’s eating (or at least browsing) habits. It turns out that there is a clear seasonal variation in the number of calories people consume. “Overall caloric intake is lowest in summer (July and August) and peaks in fall and winter,” says West and co, with the difference being about 30 kcal per serving.
They say that this is clearly related to the seasons because the trend is reversed in the southern hemisphere where users presumably have access to the same recipes but with the seasons reversed.
They also say that the average caloric intake per serving is significantly lower in the southern than the northern hemisphere at 285 versus 300 kcal, although they offer no explanation for this.
As well as this annual variation, West and co say there is clear evidence of a weekly schedule too with caloric intake peaking on Tuesdays with a minimum on Fridays.
Then there are various days when diet changes significantly, such as Christmas and Thanksgiving. West and co also highlight St Patrick’s day. “Both total calories and sodium soar to their respective annual maxima on March 17—St. Patrick’s Day,” they say. However, this seems to be skewed by an extraordinary level of overindulgence in New England and Boston!
All that is fascinating stuff but this kind of study has some important limitations, which the authors are quick to point out. Perhaps the most serious of these is the extent to which online browsing patterns reflect actual diet. West and co say they carried out a small survey of Microsoft employees who said they tended to use the recipes they found online. That’s certainly a handy indicator but its by no means a slam dunk.
There is also the question of whether people who search for online recipes are representative of the population in general. It may be that this is a special self-selecting group with dietary patterns that are somewhat different from the norm.
And supposing that people do prepare what they view online, another question is whether the nutritious content of online recipes is a good reflection of the food that is actually eaten.
Perhaps the most controversial aspect of this work is the suggestion from West that public authorities could use the firehose of data coming from browser add ons to monitor public health in real time. “Agencies could monitor trends and patterns in nutrient intake at population level and develop targeted awareness campaigns to respond to observed spikes,” they suggest
How this would work in practice isn’t clear. But the prospect of government-sponsored banner ads–PUT THE DONUT DOWN– appearing along with your search results may not appeal to everyone.
Ref: arxiv.org/abs/1304.3742: From Cookies to Cooks: Insights on Dietary Patterns via Analysis of Web Usage Logs
Keep Reading
Most Popular
Large language models can do jaw-dropping things. But nobody knows exactly why.
And that's a problem. Figuring it out is one of the biggest scientific puzzles of our time and a crucial step towards controlling more powerful future models.
The problem with plug-in hybrids? Their drivers.
Plug-in hybrids are often sold as a transition to EVs, but new data from Europe shows we’re still underestimating the emissions they produce.
How scientists traced a mysterious covid case back to six toilets
When wastewater surveillance turns into a hunt for a single infected individual, the ethics get tricky.
Google DeepMind’s new generative model makes Super Mario–like games from scratch
Genie learns how to control games by watching hours and hours of video. It could help train next-gen robots too.
Stay connected
Get the latest updates from
MIT Technology Review
Discover special offers, top stories, upcoming events, and more.